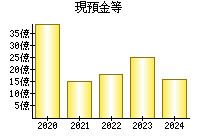
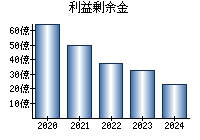
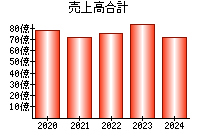
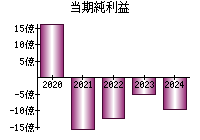
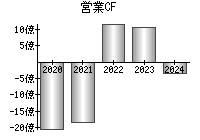
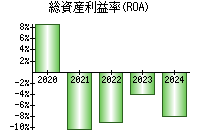
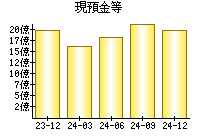
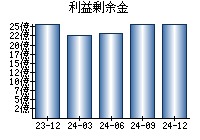
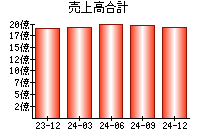
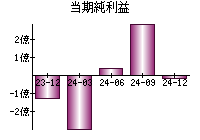
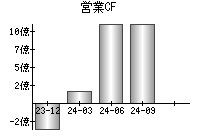
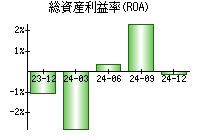
主な指標
【見方】一般に、経営状態が良い会社はグラフが右肩上がりになります。
決算書
貸借対照表(B/S)
【見方】一般に、経営が安定している会社は、黄色の部分の割合が大きく、色のバランスが毎年ほぼ同じになります。
円グラフにマウスをのせると項目を表示


損益計算書(P/L)
【見方】紫色の部分が円の左側にあるとき、会社の純利益がプラスです。一般に、純利益がプラスであり、紫色の割合は大きいほうが望ましいと言えます。
円グラフにマウスをのせると項目を表示


キャッシュフロー計算書(C/F)
【見方】赤色の部分が円の右側にあるとき、会社は本業が順調であると言えます。一般に、赤色の部分が右側にあり、その割合は大きいほうが望ましいです。
円グラフにマウスをのせると項目を表示


企業概要
| ホームページ | https://www.t-b-i.co.jp/ |
|---|---|
| 住所(Googleストリートビュー) | 東京都江東区新木場2-11-1 |
| 従業員数(単独) | 140 |
| 従業員数(連結) | 240 |
| 平均年齢(単独) | 44.6 |
| 平均勤続年数(単独) | 7.6年 |
| 平均年収(単独) | 479万円(第3,342位)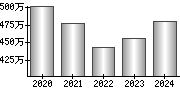
|
| 業種 | その他製品 |
| 決算月 | 3月 |
| 一株当たりの配当金 | - |
| 株主優待 |
(Yahoo!ファイナンス) |
| 経営課題・リスク等 |
サステナビリティ 対処すべき課題 事業等のリスク 経営上の重要な契約等 研究開発活動 設備投資等の概要 |
配信情報
- 情報が見つかりませんでした。
ニュース
 最新の情報を確認しています...
- 木くず搬出時に再生木質ボード納入、運搬効率化とCO2削減 長谷工と東京ボード工業:産業動向 - ITmedia

- 東京ボード工業(株)【7815】:株価・株式情報 - Yahoo!ファイナンス
- 【注目】 話題株ピックアップ【夕刊】(3):マツダ、住信SBI銀、東京ボード - かぶたん
ブログ
- 最新の情報を確認しています...
大株主 (2024)
| 27.84% | |
| 9.94% | |
| 8.8% | |
| 6.1% | |
| 3.06% |
役員
| 代表取締役社長 | |
|---|---|
| 取締役 | |
| 取締役 | |
| 取締役 | |
| 取締役 |
EDINET提出書類
- 24.11.12
-
確認書

- 24.11.12
-
半期報告書-第80期(2024/04/01-2025/03/31)
- 24.07.24
-
臨時報告書
- 24.06.26
-
内部統制報告書-第79期(2023/04/01-2024/03/31)
- 24.06.26
-
有価証券報告書-第79期(2023/04/01-2024/03/31)
就職・転職
- 情報が見つかりませんでした。