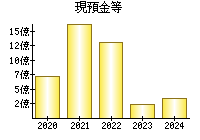
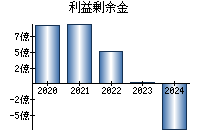
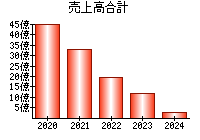
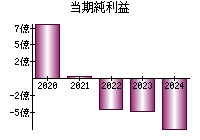
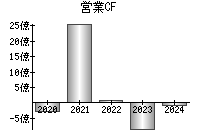
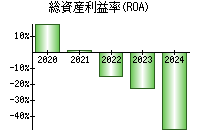
主な指標
【見方】一般に、経営状態が良い会社はグラフが右肩上がりになります。
決算書
貸借対照表(B/S)
【見方】一般に、経営が安定している会社は、黄色の部分の割合が大きく、色のバランスが毎年ほぼ同じになります。
円グラフにマウスをのせると項目を表示


損益計算書(P/L)
【見方】紫色の部分が円の左側にあるとき、会社の純利益がプラスです。一般に、純利益がプラスであり、紫色の割合は大きいほうが望ましいと言えます。
円グラフにマウスをのせると項目を表示


キャッシュフロー計算書(C/F)
【見方】赤色の部分が円の右側にあるとき、会社は本業が順調であると言えます。一般に、赤色の部分が右側にあり、その割合は大きいほうが望ましいです。
円グラフにマウスをのせると項目を表示


企業概要
| ホームページ | https://www.g3holdings.com/ |
|---|---|
| 住所(Googleストリートビュー) | 東京都品川区東品川2-3-14 東京フロントテラス |
| 従業員数(単独) | 11 |
| 従業員数(連結) | 11 |
| 平均年齢(単独) | 45.2 |
| 平均勤続年数(単独) | 2.2年 |
| 平均年収(単独) | 653万円(第1,583位)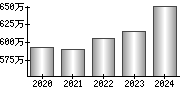
|
| 業種 | 情報・通信業 |
| 決算月 | 8月 |
| 一株当たりの配当金 | 15.00 |
| 株主優待 |
(Yahoo!ファイナンス) |
| 経営課題・リスク等 |
サステナビリティ 対処すべき課題 事業等のリスク 経営上の重要な契約等 研究開発活動 設備投資等の概要 |
配信情報
- 情報が見つかりませんでした。
ニュース
 最新の情報を確認しています...
- ジー・スリーホールディングス【3647】、上期経常が赤字縮小で着地・12-2月期も赤字縮小 | 決算速報 - 株探ニュース - かぶたん

- ジー・スリーホールディングス[3647]:当社第14期定時株主総会の結果報告(流会)について 2024年11月26日(適時開示) :日経会社情報DIGITAL - 日本経済新聞
- 【決算速報】ジー・スリーH、中間経常-177百万。(アイフィス株予報) - Yahoo!ファイナンス
ブログ
- 最新の情報を確認しています...
大株主 (2024)
| 16.15% | |
| 4.86% | |
| 3% | |
| 2.61% | |
| 2.4% |
役員
| 代表取締役 | |
|---|---|
| 取締役経営企画室長 | |
| 取締役 | |
| 取締役 | |
| 取締役(監査等委員) |
EDINET提出書類
- 25.04.11
-
確認書

- 25.04.11
-
半期報告書-第15期(2024/09/01-2025/08/31)
- 25.01.10
-
訂正報告書(大量保有報告書・変更報告書)
- 25.01.10
-
訂正報告書(大量保有報告書・変更報告書)
- 25.01.10
-
訂正報告書(大量保有報告書・変更報告書)
就職・転職
- 情報が見つかりませんでした。