 ジー・スリーホールディングス
【東証スタンダード:3647】「情報・通信業」
ジー・スリーホールディングス
【東証スタンダード:3647】「情報・通信業」
 へ投稿
へ投稿
主な指標
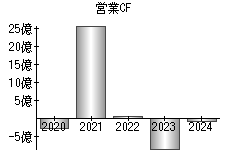
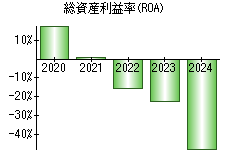
【見方】一般に、経営状態が良い会社はグラフが右肩上がりになります。
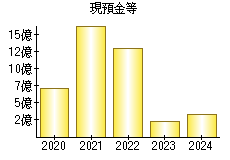
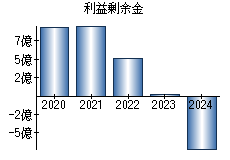
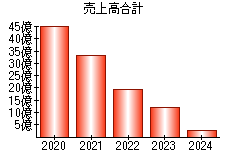
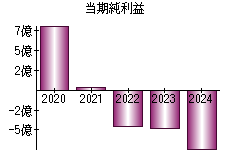
| 決算年月日 | 2020年8月31日 | 2021年8月31日 | 2022年8月31日 | 2023年8月31日 | 2024年8月31日 |
|---|---|---|---|---|---|
| 現預金等 | 720 | 1,647 | 1,302 | 226 | 334 |
| 利益剰余金 | 930 | 965 | 512 | 24 | -718 |
| 売上高 | 4,570 | 3,310 | 1,927 | 1,187 | 259 |
| 当期純利益 | 825 | 35 | -453 | -488 | -743 |
| 営業活動によるキャッシュフロー | -275 | 2,584 | 64 | -840 | -68 |
| 総資産利益率(ROA) | 18.16% | 0.93% | -15.44% | -22.81% | -47.89% |
※単位:百万円
PR
- 検索
- 業種別業績ランキング