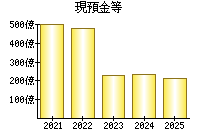
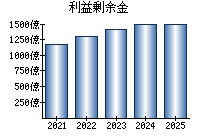
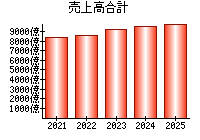
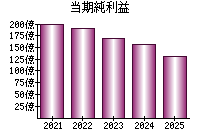
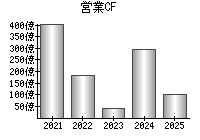
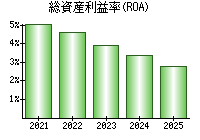
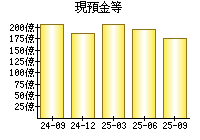
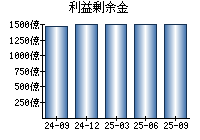
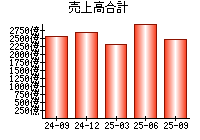
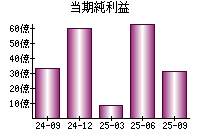
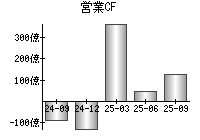
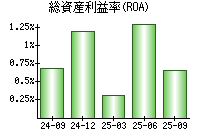
主な指標
【見方】一般に、経営状態が良い会社はグラフが右肩上がりになります。
決算書
貸借対照表(B/S)
【見方】一般に、経営が安定している会社は、黄色の部分の割合が大きく、色のバランスが毎年ほぼ同じになります。
円グラフにマウスをのせると項目を表示


損益計算書(P/L)
【見方】紫色の部分が円の左側にあるとき、会社の純利益がプラスです。一般に、純利益がプラスであり、紫色の割合は大きいほうが望ましいと言えます。
円グラフにマウスをのせると項目を表示


キャッシュフロー計算書(C/F)
【見方】赤色の部分が円の右側にあるとき、会社は本業が順調であると言えます。一般に、赤色の部分が右側にあり、その割合は大きいほうが望ましいです。
円グラフにマウスをのせると項目を表示


企業概要
| ホームページ | https://www.itoham-yonekyu-holdings.com/ |
|---|---|
| 住所(Googleストリートビュー) | 東京都目黒区三田1-6-21 |
| 従業員数(単独) | 866 |
| 従業員数(連結) | 7926 |
| 平均年齢(単独) | 42 |
| 平均勤続年数(単独) | 16.2年 |
| 平均年収(単独) | 725万円(第1,097位)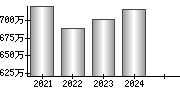
|
| 業種 | 食品業 |
| 決算月 | 3月 |
| 一株当たりの配当金 | 17.00 |
| 株主優待 |
(Yahoo!ファイナンス) |
| 経営課題・リスク等 |
サステナビリティ 対処すべき課題 事業等のリスク 経営上の重要な契約等 研究開発活動 設備投資等の概要 |
配信情報
- 情報が見つかりませんでした。
ニュース
 最新の情報を確認しています...
- 飲食マーケター必読 伊藤ハム米久が実践する行動起点のCEP開発 - 日経クロストレンド

- 「伊藤ハム米久グループ統合報告書2025」を発行 - PR TIMES
- 伊藤ハム米久HD 上期は増収増益も「もっとできた」浦田社長 - 食品新聞 WEB版
ブログ
- 最新の情報を確認しています...
大株主 (2025)
| 40.81% | |
| 6.34% | |
| 4.23% | |
| 3.62% | |
| 2.18% |
役員
| 代表取締役社長 | |
|---|---|
| 取締役常務執行役員 | |
| 取締役常務執行役員 | |
| 取締役 | |
| 取締役 |
EDINET提出書類
- 25.11.13
-
確認書

- 25.11.13
-
半期報告書-第10期(2025/04/01-2026/03/31)
- 25.06.25
-
臨時報告書
- 25.06.24
-
内部統制報告書-第9期(2024/04/01-2025/03/31)
- 25.06.24
-
確認書
就職・転職
- 情報が見つかりませんでした。