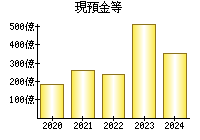
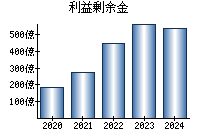
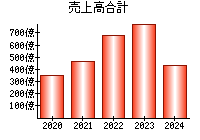
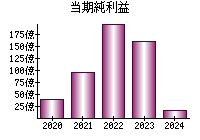
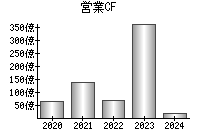
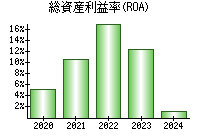
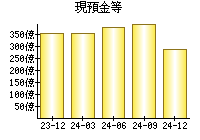
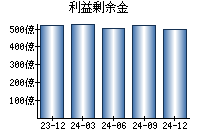
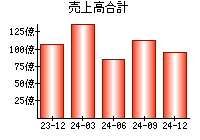
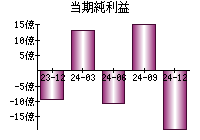
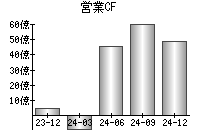
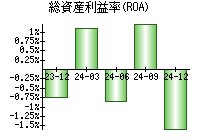
主な指標
【見方】一般に、経営状態が良い会社はグラフが右肩上がりになります。
決算書
貸借対照表(B/S)
【見方】一般に、経営が安定している会社は、黄色の部分の割合が大きく、色のバランスが毎年ほぼ同じになります。
円グラフにマウスをのせると項目を表示


損益計算書(P/L)
【見方】紫色の部分が円の左側にあるとき、会社の純利益がプラスです。一般に、純利益がプラスであり、紫色の割合は大きいほうが望ましいと言えます。
円グラフにマウスをのせると項目を表示


キャッシュフロー計算書(C/F)
【見方】赤色の部分が円の右側にあるとき、会社は本業が順調であると言えます。一般に、赤色の部分が右側にあり、その割合は大きいほうが望ましいです。
円グラフにマウスをのせると項目を表示


企業概要
| ホームページ | https://www.takara-bio.co.jp/ |
|---|---|
| 住所(Googleストリートビュー) | 滋賀県草津市野路東7-4-38 |
| 従業員数(単独) | 802 |
| 従業員数(連結) | 1838 |
| 平均年齢(単独) | 41.1 |
| 平均勤続年数(単独) | 11.5年 |
| 平均年収(単独) | 679万円(第1,385位)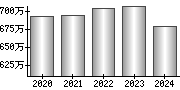
|
| 業種 | 化学 |
| 決算月 | 3月 |
| 一株当たりの配当金 | 9.00 |
| 株主優待 |
(Yahoo!ファイナンス) |
| 経営課題・リスク等 |
サステナビリティ 対処すべき課題 事業等のリスク 経営上の重要な契約等 研究開発活動 設備投資等の概要 |
配信情報
 最新の情報を確認しています...
ニュース
- 最新の情報を確認しています...
- タカラバイオ、(開示事項の経過)完全子会社の吸収合併(簡易合併)に関するお知らせ - 日経バイオテクONLINE

- 東芝とタカラバイオ、メッセンジャーRNAの医薬開発で提携 - 日本経済新聞
- メタジェンセラピューティクス、タカラバイオとマイクロバイオーム創薬の品質管理体制構築に向け提携 - PR TIMES
ブログ
- 最新の情報を確認しています...
大株主 (2024)
| 60.91% | |
| 5.28% | |
| 1.76% | |
| 0.56% | |
| 0.54% |
役員
| 代表取締役社長社長執行役員CEO | |
|---|---|
| 取締役副社長副社長執行役員 | |
| 専務取締役専務執行役員 | |
| 専務取締役専務執行役員 | |
| 専務取締役専務執行役員 |
EDINET提出書類
- 25.05.13
-
臨時報告書

- 24.11.11
-
確認書
- 24.11.11
-
半期報告書-第23期(2024/04/01-2025/03/31)
- 24.07.01
-
訂正臨時報告書
- 24.06.28
-
臨時報告書
就職・転職
採用情報URL