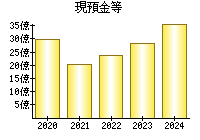
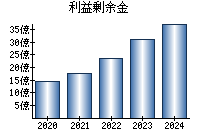
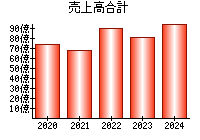
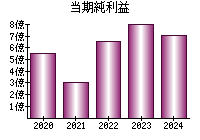
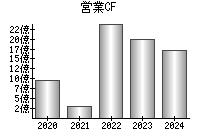
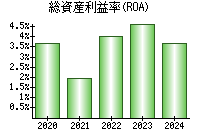
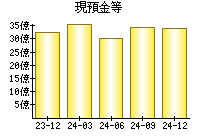
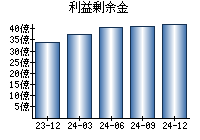
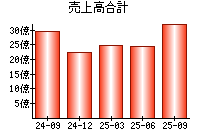
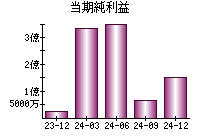
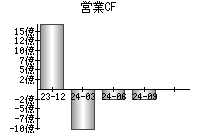
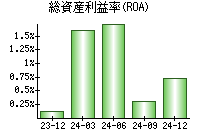
主な指標
【見方】一般に、経営状態が良い会社はグラフが右肩上がりになります。
決算書
貸借対照表(B/S)
【見方】一般に、経営が安定している会社は、黄色の部分の割合が大きく、色のバランスが毎年ほぼ同じになります。
円グラフにマウスをのせると項目を表示


損益計算書(P/L)
【見方】紫色の部分が円の左側にあるとき、会社の純利益がプラスです。一般に、純利益がプラスであり、紫色の割合は大きいほうが望ましいと言えます。
円グラフにマウスをのせると項目を表示


キャッシュフロー計算書(C/F)
【見方】赤色の部分が円の右側にあるとき、会社は本業が順調であると言えます。一般に、赤色の部分が右側にあり、その割合は大きいほうが望ましいです。
円グラフにマウスをのせると項目を表示


企業概要
| ホームページ | https://enbio-holdings.com/ |
|---|---|
| 住所(Googleストリートビュー) | 東京都千代田区鍛冶町2-2-2 神田パークプラザ |
| 従業員数(単独) | 17 |
| 従業員数(連結) | 104 |
| 平均年齢(単独) | 40.7 |
| 平均勤続年数(単独) | 4.3年 |
| 平均年収(単独) | 538万円(第2,785位)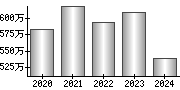
|
| 業種 | サービス業 |
| 決算月 | 3月 |
| 一株当たりの配当金 | - |
| 株主優待 |
(Yahoo!ファイナンス) |
| 経営課題・リスク等 |
サステナビリティ 対処すべき課題 事業等のリスク 経営上の重要な契約等 研究開発活動 設備投資等の概要 |
配信情報
- 情報が見つかりませんでした。
ニュース
 最新の情報を確認しています...
- FITから自家消費・PPAに転換、エンバイオの屋根上太陽光 - 探訪 - メガソーラービジネス - 日経BP

- 【決算速報】エンバイオH、3Q累計経常869百万。(アイフィス株予報) - Yahoo!ファイナンス
- エンバイオHは3日続伸、関連会社が「南アンマン排水処理プロジェクト」を開始 - みんかぶ
ブログ
- 最新の情報を確認しています...
大株主 (2024)
| 34.16% | |
| 6.09% | |
| 5.31% | |
| 2.46% | |
| 1.34% |
役員
| 代表取締役社長 | |
|---|---|
| 取締役会長 | |
| 取締役 | |
| 取締役 | |
| 取締役 |
EDINET提出書類
- 24.11.14
-
確認書

- 24.11.14
-
半期報告書-第26期(2024/04/01-2024/09/30)
- 24.09.05
-
自己株券買付状況報告書(法24条の6第1項に基づくもの)
- 24.08.05
-
自己株券買付状況報告書(法24条の6第1項に基づくもの)
- 24.07.05
-
自己株券買付状況報告書(法24条の6第1項に基づくもの)
就職・転職
- 情報が見つかりませんでした。