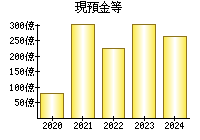
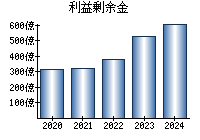
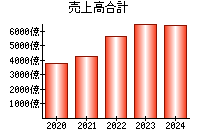
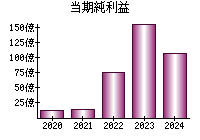
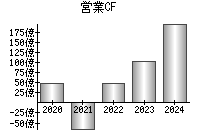
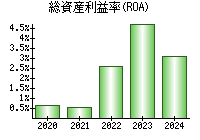
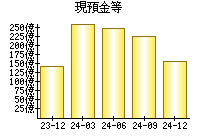
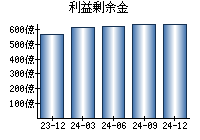
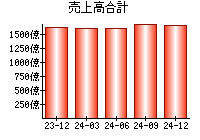
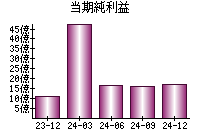
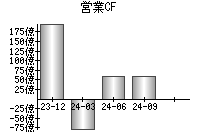
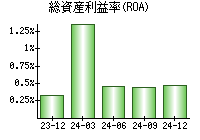
主な指標
【見方】一般に、経営状態が良い会社はグラフが右肩上がりになります。
決算書
貸借対照表(B/S)
【見方】一般に、経営が安定している会社は、黄色の部分の割合が大きく、色のバランスが毎年ほぼ同じになります。
円グラフにマウスをのせると項目を表示


損益計算書(P/L)
【見方】紫色の部分が円の左側にあるとき、会社の純利益がプラスです。一般に、純利益がプラスであり、紫色の割合は大きいほうが望ましいと言えます。
円グラフにマウスをのせると項目を表示


キャッシュフロー計算書(C/F)
【見方】赤色の部分が円の右側にあるとき、会社は本業が順調であると言えます。一般に、赤色の部分が右側にあり、その割合は大きいほうが望ましいです。
円グラフにマウスをのせると項目を表示


企業概要
| ホームページ | https://www.kppc.co.jp/ja/top.html |
|---|---|
| 住所(Googleストリートビュー) | 東京都中央区明石町6-24 |
| 従業員数(単独) | 52 |
| 従業員数(連結) | 5624 |
| 平均年齢(単独) | 46.1 |
| 平均勤続年数(単独) | 12年 |
| 平均年収(単独) | 921万円(第259位)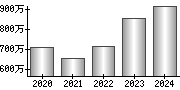
|
| 業種 | 卸売業 |
| 決算月 | 3月 |
| 一株当たりの配当金 | 10.00 |
| 株主優待 |
(Yahoo!ファイナンス) |
| 経営課題・リスク等 |
サステナビリティ 対処すべき課題 事業等のリスク 経営上の重要な契約等 研究開発活動 設備投資等の概要 |
配信情報
- 情報が見つかりませんでした。
ニュース
 最新の情報を確認しています...
- KPPグループHD、株主優待の新設と増配を発表して、配当+優待利回り=6.4%に! 3月末に100株以上を保有すると1000円分の「図書カード」がもらえることに!(ダイヤモンド・ザイ) - Yahoo!ニュース

- KPPグループホールディングス【9274】、今期経常を一転25%減益に下方修正、配当は2円増額 | 決算速報 - 株探ニュース - かぶたん
- KPPグループホールディングス[9274]:2025年3月期 第3四半期決算短信〔日本基準〕(連結) 2025年2月14日(適時開示) :日経会社情報DIGITAL - 日本経済新聞
ブログ
- 最新の情報を確認しています...
大株主 (2024)
| 18.13% | |
| 11.2% | |
| 7.5% | |
| 5.69% | |
| 3.23% |
役員
| 代表取締役会長兼CEO | |
|---|---|
| 代表取締役社長兼COO | |
| 取締役 | |
| 取締役 | |
| 取締役 |
EDINET提出書類
- 25.03.25
-
変更報告書

- 25.03.17
-
大量保有報告書(特例対象株券等)
- 25.02.03
-
自己株券買付状況報告書(法24条の6第1項に基づくもの)
- 25.01.06
-
自己株券買付状況報告書(法24条の6第1項に基づくもの)
- 24.12.02
-
自己株券買付状況報告書(法24条の6第1項に基づくもの)
就職・転職
- 情報が見つかりませんでした。