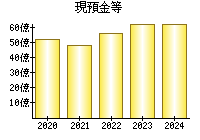
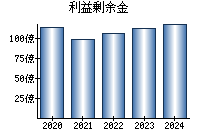
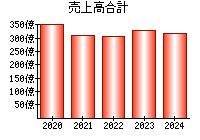
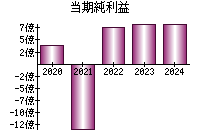
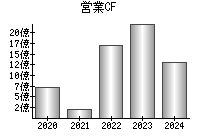
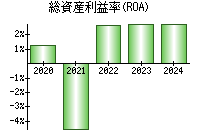
主な指標
【見方】一般に、経営状態が良い会社はグラフが右肩上がりになります。


決算書
貸借対照表(B/S)
【見方】一般に、経営が安定している会社は、黄色の部分の割合が大きく、色のバランスが毎年ほぼ同じになります。
円グラフにマウスをのせると項目を表示


損益計算書(P/L)
【見方】紫色の部分が円の左側にあるとき、会社の純利益がプラスです。一般に、純利益がプラスであり、紫色の割合は大きいほうが望ましいと言えます。
円グラフにマウスをのせると項目を表示


キャッシュフロー計算書(C/F)
【見方】赤色の部分が円の右側にあるとき、会社は本業が順調であると言えます。一般に、赤色の部分が右側にあり、その割合は大きいほうが望ましいです。
円グラフにマウスをのせると項目を表示


企業概要
| ホームページ | https://www.takeda-prn.co.jp/ |
|---|---|
| 住所(Googleストリートビュー) | 名古屋市昭和区白金1-11-10 |
| 従業員数(単独) | 48 |
| 従業員数(連結) | 928 |
| 平均年齢(単独) | 45 |
| 平均勤続年数(単独) | 17.9年 |
| 平均年収(単独) | 561万円(第2,573位)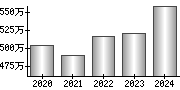
|
| 業種 | その他製品 |
| 決算月 | 3月 |
| 一株当たりの配当金 | 10.00 |
| 株主優待 |
(Yahoo!ファイナンス) |
| 経営課題・リスク等 |
サステナビリティ 対処すべき課題 事業等のリスク 経営上の重要な契約等 研究開発活動 設備投資等の概要 |
配信情報
- 情報が見つかりませんでした。
ニュース
 最新の情報を確認しています...
- 竹田iPホールディングス[7875]:個人投資家様向けIR紹介動画公開のお知らせ 2025年3月13日(適時開示) :日経会社情報DIGITAL - 日本経済新聞

- 「実は半導体関連銘柄」竹田iPホールディングスの新たな挑戦!【IR広告】 - トウシル
- 竹田iPホールディングス、社長に細野浩之氏 - 日刊工業新聞 電子版
ブログ
- 最新の情報を確認しています...
大株主 (2024)
| 6.33% | |
| 4.22% | |
| 4.15% | |
| 2.89% | |
| 2.53% |
役員
| 代表取締役会長CEO | |
|---|---|
| 代表取締役社長COO | |
| 専務取締役CSO経営戦略担当 | |
| 常務取締役CFO経営管理担当全社統括 | |
| 取締役 |
EDINET提出書類
- 24.11.13
-
半期報告書-第87期(2024/04/01-2025/03/31)

- 24.11.13
-
確認書
- 24.07.01
-
臨時報告書
- 24.06.28
-
内部統制報告書-第86期(2023/04/01-2024/03/31)
- 24.06.28
-
確認書
就職・転職
採用情報URL