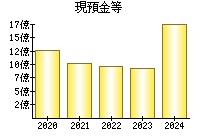
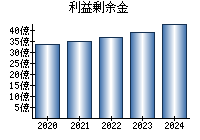
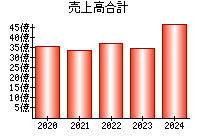
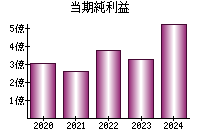
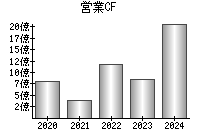
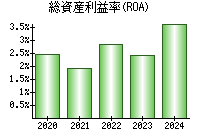
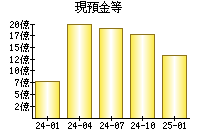
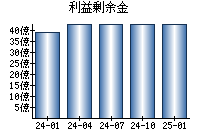
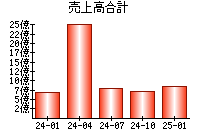
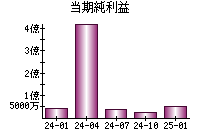
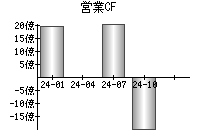
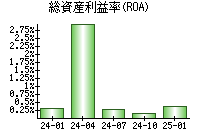
主な指標
【見方】一般に、経営状態が良い会社はグラフが右肩上がりになります。
決算書
貸借対照表(B/S)
【見方】一般に、経営が安定している会社は、黄色の部分の割合が大きく、色のバランスが毎年ほぼ同じになります。
円グラフにマウスをのせると項目を表示


損益計算書(P/L)
【見方】紫色の部分が円の左側にあるとき、会社の純利益がプラスです。一般に、純利益がプラスであり、紫色の割合は大きいほうが望ましいと言えます。
円グラフにマウスをのせると項目を表示


キャッシュフロー計算書(C/F)
【見方】赤色の部分が円の右側にあるとき、会社は本業が順調であると言えます。一般に、赤色の部分が右側にあり、その割合は大きいほうが望ましいです。
円グラフにマウスをのせると項目を表示


企業概要
| ホームページ | https://www.early-age.co.jp/ |
|---|---|
| 住所(Googleストリートビュー) | 東京都港区赤坂2-11-7 ATT新館 |
| 従業員数(単独) | 14 |
| 従業員数(連結) | 15 |
| 平均年齢(単独) | 38.7 |
| 平均勤続年数(単独) | 10.2年 |
| 平均年収(単独) | 494万円(第3,226位)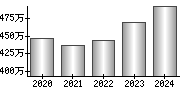
|
| 業種 | 不動産業 |
| 決算月 | 10月 |
| 一株当たりの配当金 | 28.00 |
| 株主優待 |
(Yahoo!ファイナンス) |
| 経営課題・リスク等 |
対処すべき課題 事業等のリスク 経営上の重要な契約等 研究開発活動 設備投資等の概要 |
配信情報
- 情報が見つかりませんでした。
ニュース
 最新の情報を確認しています...
- アールエイジが4日ぶり反落、25年10月期第2四半期決算は減収減益(ウエルスアドバイザー) - Yahoo!ファイナンス

- アールエイジ[3248]:2025年定時株主総会招集通知 2024年12月27日(適時開示) :日経会社情報DIGITAL - 日本経済新聞
- グローバルビューティー企業APR(代表取締役キム·ビョンフン)のビューティーデバイスブランドメディキューブエイジアール(AGE-R)が海外で突風を巻き起こし、グローバル累積販売台数400万台を超えた。 - 매일경제
ブログ
- 最新の情報を確認しています...
大株主 (2024)
| 50.02% | |
| 4.82% | |
| 2.99% | |
| 2.86% | |
| 1.96% |
役員
| 代表取締役 | |
|---|---|
| 専務取締役空間事業本部長 | |
| 取締役管理本部長 | |
| 取締役空間事業本部運営管理部長 | |
| 取締役(監査等委員) |
EDINET提出書類
- 25.06.11
-
確認書

- 25.06.11
-
半期報告書-第39期(2024/11/01-2025/10/31)
- 25.02.28
-
親会社等状況報告書(内国会社)-第23期(2023/12/01-2024/11/30)
- 25.01.30
-
臨時報告書
- 25.01.24
-
確認書
就職・転職
採用情報URL


