 関門海
【東証スタンダード:3372】「小売業」
関門海
【東証スタンダード:3372】「小売業」
 へ投稿
へ投稿
主な指標
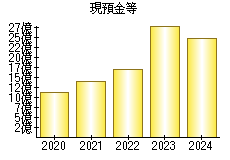
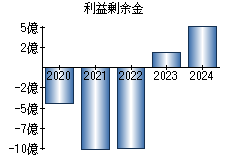
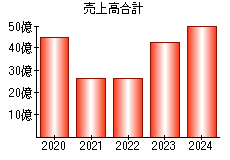
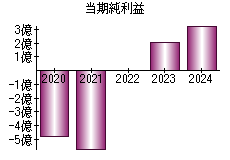
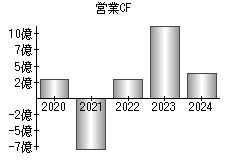
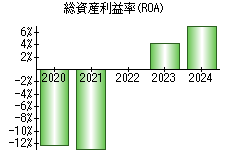
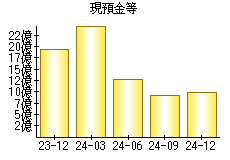
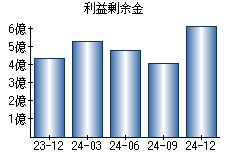
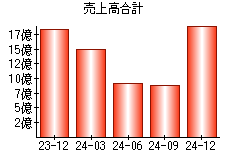
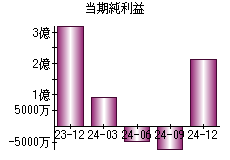
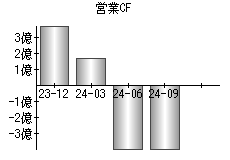
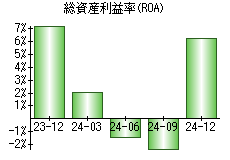
【見方】一般に、経営状態が良い会社はグラフが右肩上がりになります。
| 決算年月日 | 2020年3月31日 | 2021年3月31日 | 2022年3月31日 | 2023年3月31日 | 2024年3月31日 |
|---|---|---|---|---|---|
| 現預金等 | 1,125 | 1,396 | 1,695 | 2,810 | 2,474 |
| 利益剰余金 | -440 | -1,008 | -1,008 | 195 | 532 |
| 売上高 | 4,473 | 2,635 | 2,604 | 4,210 | 5,016 |
| 当期純利益 | -479 | -570 | 1 | 206 | 331 |
| 営業活動によるキャッシュフロー | 287 | -787 | 294 | 1,137 | 380 |
| 総資産利益率(ROA) | -12.33% | -12.89% | 0.01% | 4.24% | 7.18% |
※単位:百万円
PR
- 検索
- 業種別業績ランキング