 西松屋チェーン
【東証プライム:7545】「小売業」
西松屋チェーン
【東証プライム:7545】「小売業」
 へ投稿
へ投稿
主な指標
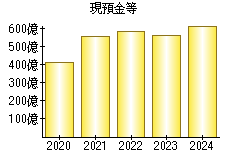
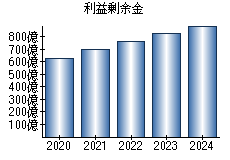
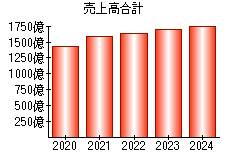
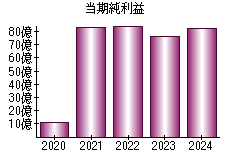
【見方】一般に、経営状態が良い会社はグラフが右肩上がりになります。
| 決算年月日 | 2020年2月20日 | 2021年2月20日 | 2022年2月20日 | 2023年2月20日 | 2024年2月20日 |
|---|---|---|---|---|---|
| 現預金等 | 41,360 | 55,655 | 58,461 | 56,266 | 61,935 |
| 利益剰余金 | 62,781 | 69,490 | 76,482 | 82,556 | 89,266 |
| 売上高 | 142,954 | 159,418 | 163,016 | 169,524 | 177,188 |
| 当期純利益 | 1,077 | 8,277 | 8,498 | 7,640 | 8,202 |
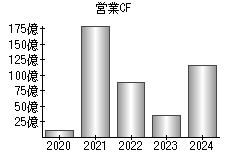
| 営業活動によるキャッシュフロー | 1,114 | 18,072 | 8,750 | 3,467 | 11,541 |
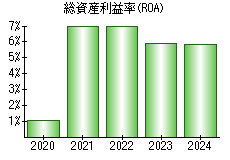
| 総資産利益率(ROA) | 1.03% | 7.05% | 6.94% | 5.90% | 5.84% |
※単位:百万円
PR
- 検索
- 業種別業績ランキング