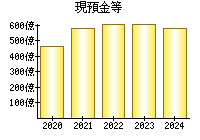
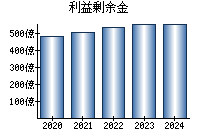
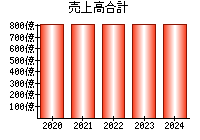
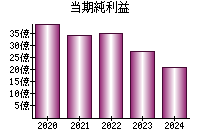
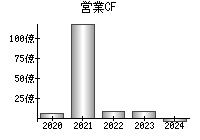
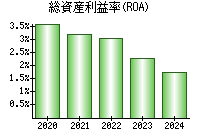
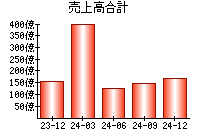
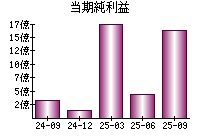
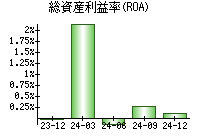
主な指標
【見方】一般に、経営状態が良い会社はグラフが右肩上がりになります。
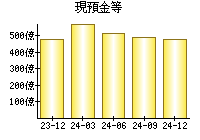
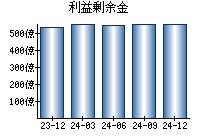

決算書
貸借対照表(B/S)
【見方】一般に、経営が安定している会社は、黄色の部分の割合が大きく、色のバランスが毎年ほぼ同じになります。
円グラフにマウスをのせると項目を表示


損益計算書(P/L)
【見方】紫色の部分が円の左側にあるとき、会社の純利益がプラスです。一般に、純利益がプラスであり、紫色の割合は大きいほうが望ましいと言えます。
円グラフにマウスをのせると項目を表示


キャッシュフロー計算書(C/F)
【見方】赤色の部分が円の右側にあるとき、会社は本業が順調であると言えます。一般に、赤色の部分が右側にあり、その割合は大きいほうが望ましいです。
円グラフにマウスをのせると項目を表示


企業概要
| ホームページ | https://nisshin-hd.co.jp/ |
|---|---|
| 住所(Googleストリートビュー) | 東京都新宿区新宿5-8-1 |
| 従業員数(単独) | 8 |
| 従業員数(連結) | 700 |
| 平均年齢(単独) | 43.8 |
| 平均勤続年数(単独) | 16年 |
| 平均年収(単独) | 545万円(第2,736位)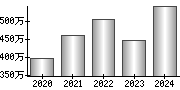
|
| 業種 | 不動産業 |
| 決算月 | 3月 |
| 一株当たりの配当金 | 16.00 |
| 株主優待 |
(Yahoo!ファイナンス) |
| 経営課題・リスク等 |
サステナビリティ 対処すべき課題 事業等のリスク 経営上の重要な契約等 研究開発活動 設備投資等の概要 |
配信情報
 最新の情報を確認しています...
ニュース
- 最新の情報を確認しています...
- 日神グループHD、中間期は増収増益で黒字転換 配当性向50%で株主還元強化、証券化事業・投資物件開発推進に意欲 - logmi Finance

- シュローダー・インベストメント・マネジメント株式会社が㈱日神グループホールディングス<8881>株式の変更報告書を提出(保有減少) - dメニューニュース
- 【5%】 日神GHDについて、英シュローダー・インベストメントは保有割合が5%未満に減少したと報告 [変更報告書No.1] - かぶたん
ブログ
- 最新の情報を確認しています...
大株主 (2024)
| 35.19% | |
| 7.36% | |
| 2.99% | |
| 2.98% | |
| 2.13% |
役員
| 代表取締役社長 | |
|---|---|
| 代表取締役専務 | |
| 取締役 | |
| 取締役 | |
| 取締役 |
EDINET提出書類
- 25.03.21
-
変更報告書(特例対象株券等)

- 25.03.07
-
臨時報告書
- 24.11.13
-
確認書
- 24.11.13
-
半期報告書-第51期(2024/04/01-2025/03/31)
- 24.07.10
-
確認書
就職・転職
採用情報URL