 交換できるくん
【東証グロース:7695】「小売業」
交換できるくん
【東証グロース:7695】「小売業」
 へ投稿
へ投稿
主な指標
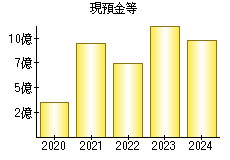
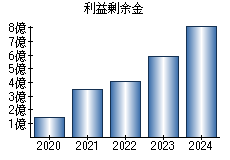
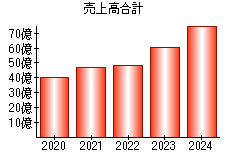
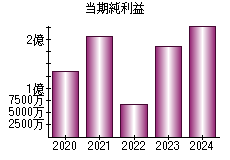
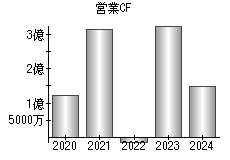
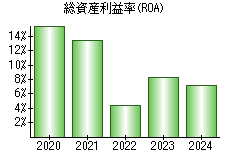
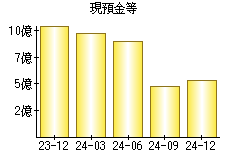
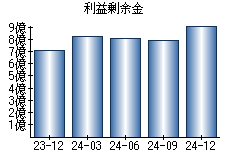
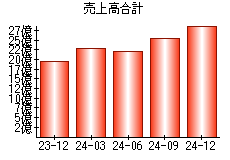
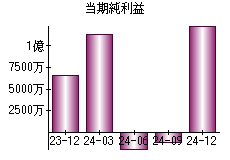
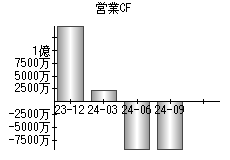
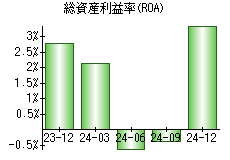
【見方】一般に、経営状態が良い会社はグラフが右肩上がりになります。
| 決算年月日 | 2023年12月31日 | 2024年3月31日 | 2024年6月30日 | 2024年9月30日 | 2024年12月31日 |
|---|---|---|---|---|---|
| 現預金等 | 1,053 | 975 | 894 | 478 | 535 |
| 利益剰余金 | 709 | 821 | 802 | 791 | 917 |
| 売上高 | 1,964 | 2,283 | 2,199 | 2,535 | 2,896 |
| 当期純利益 | 66 | 113 | -19 | -11 | 124 |
| 営業活動によるキャッシュフロー | 149 | 21 | -92 | -92 | - |
| 総資産利益率(ROA) | 2.77% | 2.13% | -0.61% | -0.35% | 3.37% |
※単位:百万円
PR
- 検索
- 業種別業績ランキング