 リンクバル
【東証グロース:6046】「サービス業」
リンクバル
【東証グロース:6046】「サービス業」
 へ投稿
へ投稿
主な指標
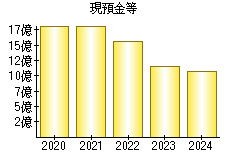
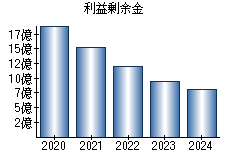
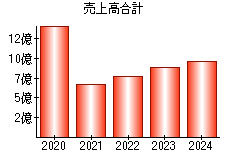
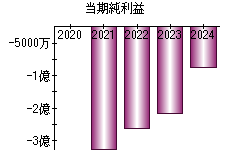
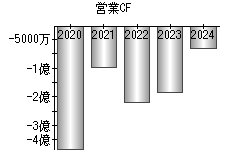
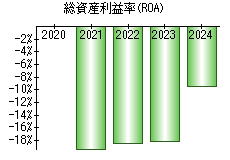
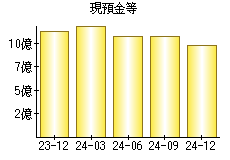
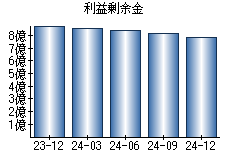
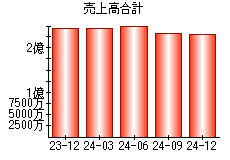
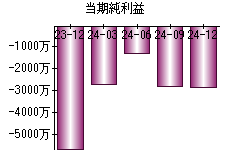
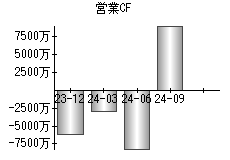
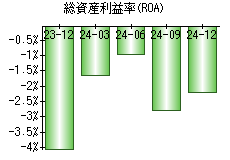
【見方】一般に、経営状態が良い会社はグラフが右肩上がりになります。
| 決算年月日 | 2023年12月31日 | 2024年3月31日 | 2024年6月30日 | 2024年9月30日 | 2024年12月31日 |
|---|---|---|---|---|---|
| 現預金等 | 1,126 | 1,196 | 1,079 | 1,072 | 972 |
| 利益剰余金 | 882 | 855 | 842 | 814 | 786 |
| 売上高 | 242 | 243 | 251 | 232 | 229 |
| 当期純利益 | -56 | -27 | -13 | -28 | -28 |
| 営業活動によるキャッシュフロー | -62 | -30 | -82 | 92 | - |
| 総資産利益率(ROA) | -4.05% | -1.66% | -0.97% | -2.79% | -2.21% |
※単位:百万円
PR
- 検索
- 業種別業績ランキング