 ノイルイミューン・バイオテック
【東証グロース:4893】「医薬品」
ノイルイミューン・バイオテック
【東証グロース:4893】「医薬品」
 へ投稿
へ投稿
主な指標
【見方】一般に、経営状態が良い会社はグラフが右肩上がりになります。
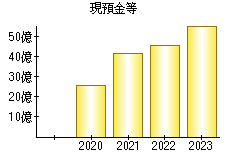
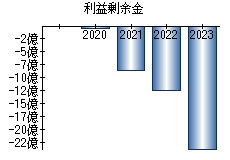
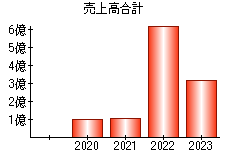
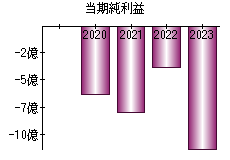
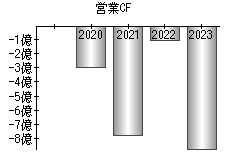
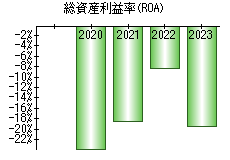
| 決算年月日 | 2020年12月31日 | 2021年12月31日 | 2022年12月31日 | 2023年12月31日 | |
|---|---|---|---|---|---|
| 現預金等 | - | 2,548 | 4,141 | 4,521 | 5,556 |
| 利益剰余金 | - | -73 | -868 | -1,252 | -2,382 |
| 売上高 | - | 97 | 101 | 626 | 317 |
| 当期純利益 | - | -637 | -795 | -387 | -1,130 |
| 営業活動によるキャッシュフロー | - | -301 | -777 | -107 | -873 |
| 総資産利益率(ROA) | -% | -23.81% | -18.61% | -8.33% | -19.55% |
※単位:百万円
PR

- 検索
- 業種別業績ランキング