 ネクスグループ
【東証スタンダード:6634】「電気機器」
ネクスグループ
【東証スタンダード:6634】「電気機器」
 へ投稿
へ投稿
主な指標
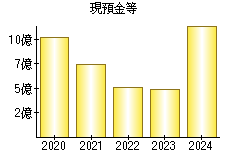
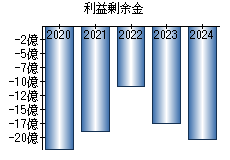
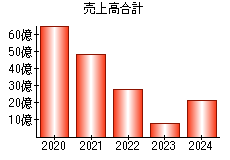
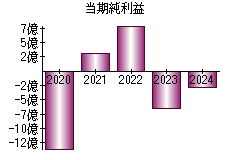
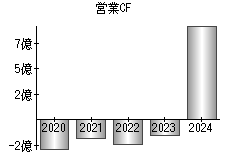
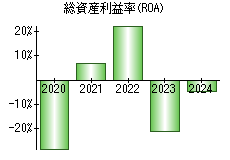
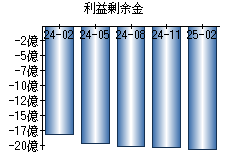
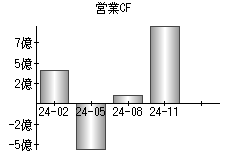
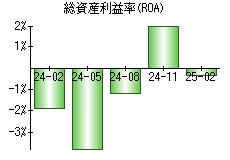
【見方】一般に、経営状態が良い会社はグラフが右肩上がりになります。
| 決算年月日 | 2020年11月30日 | 2021年11月30日 | 2022年11月30日 | 2023年11月30日 | 2024年11月30日 |
|---|---|---|---|---|---|
| 現預金等 | 1,017 | 740 | 509 | 484 | 1,149 |
| 利益剰余金 | -2,210 | -1,904 | -1,097 | -1,757 | -2,042 |
| 売上高 | 6,561 | 4,848 | 2,758 | 802 | 2,130 |
| 当期純利益 | -1,362 | 304 | 807 | -658 | -290 |
| 営業活動によるキャッシュフロー | -285 | -181 | -246 | -149 | 930 |
| 総資産利益率(ROA) | -28.48% | 6.70% | 22.82% | -21.35% | -4.88% |
※単位:百万円


PR
- 検索
- 業種別業績ランキング


