 ディジタルメディアプロフェッショナル
【東証グロース:3652】「情報・通信業」
ディジタルメディアプロフェッショナル
【東証グロース:3652】「情報・通信業」
 へ投稿
へ投稿
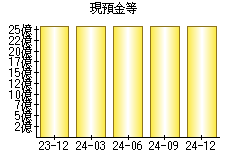
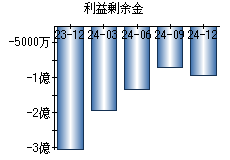
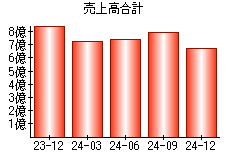
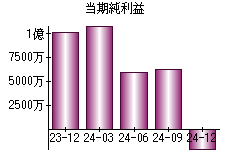
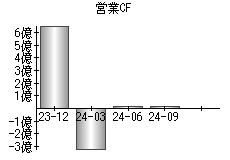
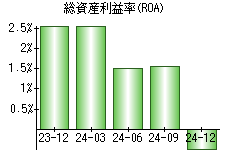
主な指標
【見方】一般に、経営状態が良い会社はグラフが右肩上がりになります。
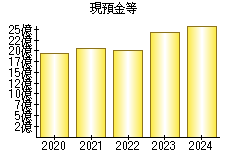
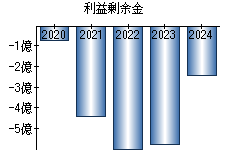
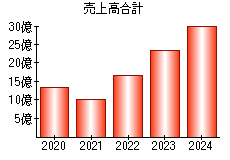
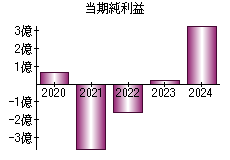
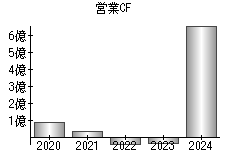
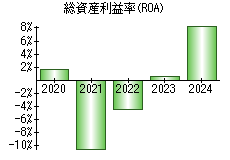
| 決算年月日 | 2020年3月31日 | 2021年3月31日 | 2022年3月31日 | 2023年3月31日 | 2024年3月31日 |
|---|---|---|---|---|---|
| 現預金等 | 1,950 | 2,066 | 2,003 | 2,436 | 2,604 |
| 利益剰余金 | -76 | -440 | -598 | -575 | -244 |
| 売上高 | 1,328 | 1,010 | 1,668 | 2,322 | 3,016 |
| 当期純利益 | 65 | -365 | -157 | 23 | 331 |
| 営業活動によるキャッシュフロー | 84 | 36 | -40 | -38 | 661 |
| 総資産利益率(ROA) | 1.70% | -10.49% | -4.53% | 0.59% | 8.45% |
※単位:百万円
PR
- 検索
- 業種別業績ランキング