 ジーフット
【東証スタンダード:2686】「小売業」
ジーフット
【東証スタンダード:2686】「小売業」
 へ投稿
へ投稿
主な指標
【見方】一般に、経営状態が良い会社はグラフが右肩上がりになります。
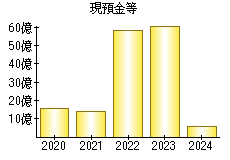
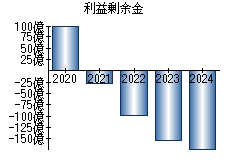
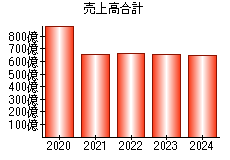
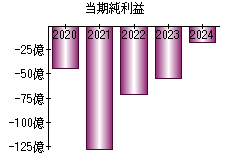
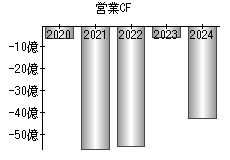
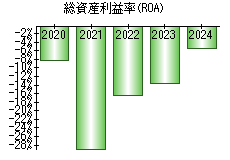
| 決算年月日 | 2020年2月29日 | 2021年2月28日 | 2022年2月28日 | 2023年2月28日 | 2024年2月29日 |
|---|---|---|---|---|---|
| 現預金等 | 1,559 | 1,372 | 5,841 | 6,115 | 583 |
| 利益剰余金 | 10,146 | -2,784 | -9,926 | -15,447 | -17,218 |
| 売上高 | 89,089 | 65,849 | 66,266 | 65,695 | 64,601 |
| 当期純利益 | -4,453 | -12,715 | -7,141 | -5,522 | -1,767 |
| 営業活動によるキャッシュフロー | -608 | -5,673 | -5,544 | -555 | -4,264 |
| 総資産利益率(ROA) | -8.37% | -28.89% | -16.49% | -13.72% | -5.41% |
※単位:百万円
PR
- 検索
- 業種別業績ランキング