 ジーデップ・アドバンス
【東証スタンダード:5885】「卸売業」
ジーデップ・アドバンス
【東証スタンダード:5885】「卸売業」
 へ投稿
へ投稿
主な指標
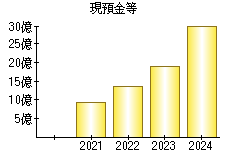
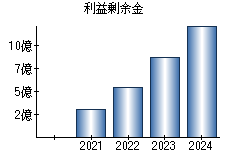
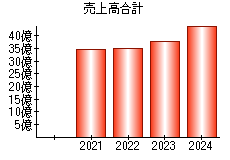
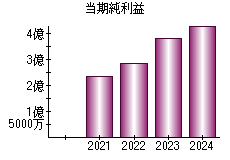
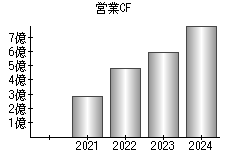
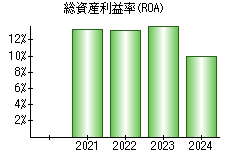
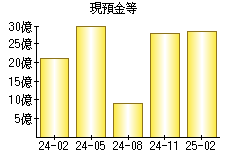
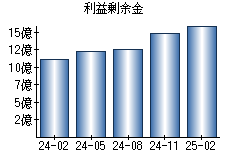
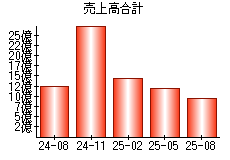
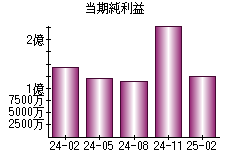
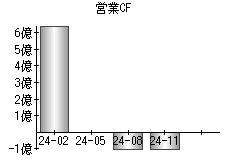
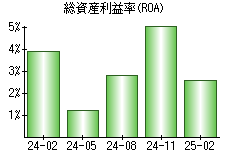
【見方】一般に、経営状態が良い会社はグラフが右肩上がりになります。
| 決算年月日 | 2021年5月31日 | 2022年5月31日 | 2023年5月31日 | 2024年5月31日 | |
|---|---|---|---|---|---|
| 現預金等 | - | 930 | 1,353 | 1,880 | 3,006 |
| 利益剰余金 | - | 304 | 540 | 862 | 1,220 |
| 売上高 | - | 3,442 | 3,491 | 3,779 | 4,422 |
| 当期純利益 | - | 233 | 283 | 378 | 432 |
| 営業活動によるキャッシュフロー | - | 283 | 477 | 590 | 785 |
| 総資産利益率(ROA) | -% | 13.25% | 13.19% | 13.85% | 9.97% |
※単位:百万円
PR
- 検索
- 業種別業績ランキング


