 インバウンドプラットフォーム
【東証グロース:5587】「情報・通信業」
インバウンドプラットフォーム
【東証グロース:5587】「情報・通信業」
 へ投稿
へ投稿
主な指標
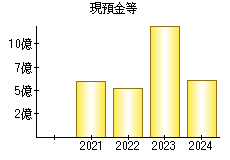
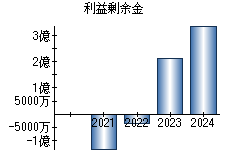
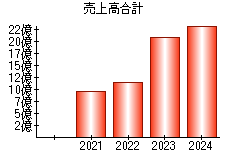
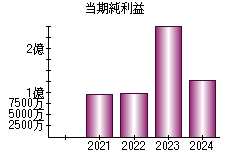
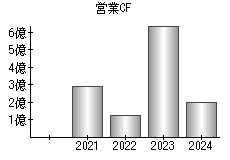
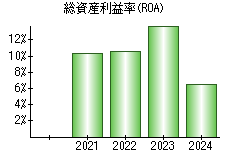
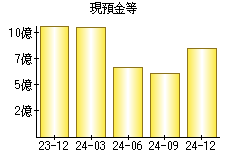
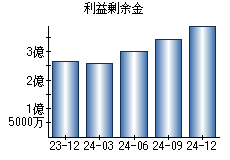
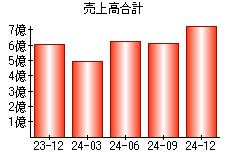
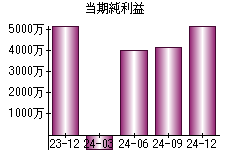
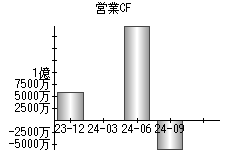
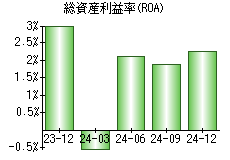
【見方】一般に、経営状態が良い会社はグラフが右肩上がりになります。
| 決算年月日 | 2021年9月30日 | 2022年9月30日 | 2023年9月30日 | 2024年9月30日 | |
|---|---|---|---|---|---|
| 現預金等 | - | 596 | 521 | 1,204 | 610 |
| 利益剰余金 | - | -134 | -37 | 215 | 342 |
| 売上高 | - | 945 | 1,139 | 2,077 | 2,334 |
| 当期純利益 | - | 96 | 97 | 252 | 127 |
| 営業活動によるキャッシュフロー | - | 292 | 121 | 643 | 200 |
| 総資産利益率(ROA) | -% | 10.29% | 10.54% | 13.84% | 6.50% |
※単位:百万円
PR
- 検索
- 業種別業績ランキング