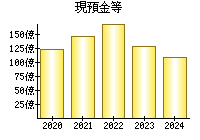
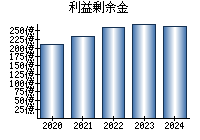
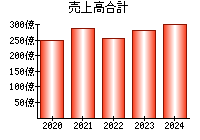
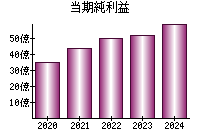
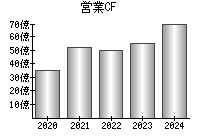
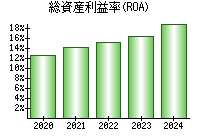
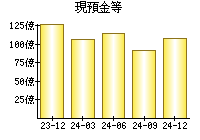
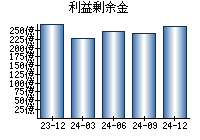
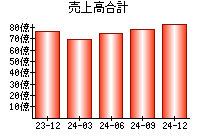
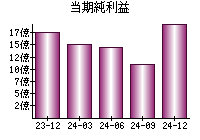
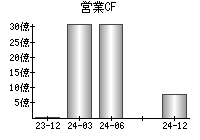
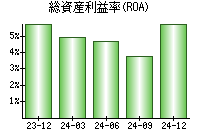
主な指標
【見方】一般に、経営状態が良い会社はグラフが右肩上がりになります。
決算書
貸借対照表(B/S)
【見方】一般に、経営が安定している会社は、黄色の部分の割合が大きく、色のバランスが毎年ほぼ同じになります。
円グラフにマウスをのせると項目を表示


損益計算書(P/L)
【見方】紫色の部分が円の左側にあるとき、会社の純利益がプラスです。一般に、純利益がプラスであり、紫色の割合は大きいほうが望ましいと言えます。
円グラフにマウスをのせると項目を表示


キャッシュフロー計算書(C/F)
【見方】赤色の部分が円の右側にあるとき、会社は本業が順調であると言えます。一般に、赤色の部分が右側にあり、その割合は大きいほうが望ましいです。
円グラフにマウスをのせると項目を表示


企業概要
| ホームページ | https://hd.funaisoken.co.jp/ |
|---|---|
| 住所(Googleストリートビュー) | 大阪市中央区北浜4-4-10 |
| 従業員数(単独) | 124 |
| 従業員数(連結) | 1535 |
| 平均年齢(単独) | 39.4 |
| 平均勤続年数(単独) | 9.4年 |
| 平均年収(単独) | 669万円(第1,440位)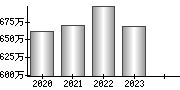
|
| 業種 | サービス業 |
| 決算月 | 12月 |
| 一株当たりの配当金 | 45.00 |
| 株主優待 |
(Yahoo!ファイナンス) |
| 経営課題・リスク等 |
対処すべき課題 事業等のリスク 経営上の重要な契約等 研究開発活動 設備投資等の概要 |
配信情報
- 情報が見つかりませんでした。
ニュース
 最新の情報を確認しています...
- 船井総研HD、あがたグローバル経営グループと合弁会社設立を基本合意 - PR TIMES

- 船井総研HD - 日本経済新聞
- 船井総研HD、今期経常は6%増で5期連続最高益、10円増配へ - かぶたん
ブログ
- 最新の情報を確認しています...
大株主 (2023)
| 12.03% | |
| 10.51% | |
| 5.21% | |
| 4.59% | |
| 4.08% |
役員
| 代表取締役社長グループCEO | |
|---|---|
| 取締役専務執行役員コーポレートマネジメント本部本部長 | |
| 取締役執行役員コーポレートビジネス本部本部長 | |
| 取締役社外取締役 | |
| 取締役社外取締役 |
EDINET提出書類
- 25.04.02
-
臨時報告書

- 25.03.31
-
確認書
- 25.03.31
-
内部統制報告書-第55期(2024/01/01-2024/12/31)
- 25.03.31
-
有価証券報告書-第55期(2024/01/01-2024/12/31)
- 25.01.16
-
自己株券買付状況報告書(法24条の6第1項に基づくもの)
就職・転職
採用情報URL