 前田工繊
【東証プライム:7821】「その他製品」
前田工繊
【東証プライム:7821】「その他製品」
 へ投稿
へ投稿
主な指標
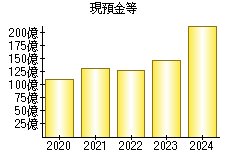
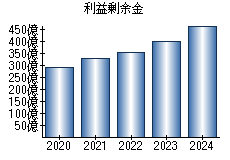
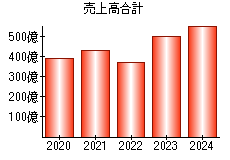
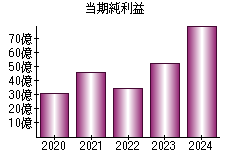
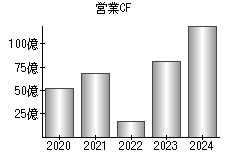
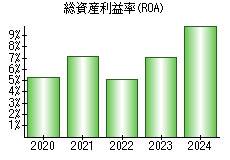
【見方】一般に、経営状態が良い会社はグラフが右肩上がりになります。
| 決算年月日 | 2020年9月20日 | 2021年9月20日 | 2022年6月30日 | 2023年6月30日 | 2024年6月30日 |
|---|---|---|---|---|---|
| 現預金等 | 11,052 | 13,099 | 12,808 | 14,576 | 21,431 |
| 利益剰余金 | 28,853 | 32,772 | 35,425 | 39,831 | 46,779 |
| 売上高 | 39,365 | 43,236 | 36,901 | 50,204 | 55,833 |
| 当期純利益 | 3,089 | 4,595 | 3,482 | 5,258 | 7,980 |
| 営業活動によるキャッシュフロー | 5,180 | 6,817 | 1,684 | 8,130 | 12,023 |
| 総資産利益率(ROA) | 5.28% | 7.15% | 5.06% | 7.03% | 9.94% |
※単位:百万円
PR

- 検索
- 業種別業績ランキング