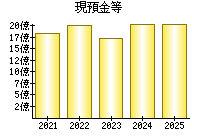
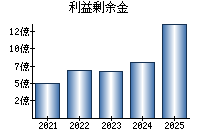
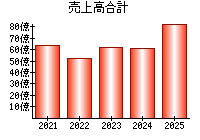
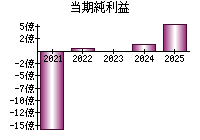
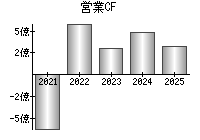
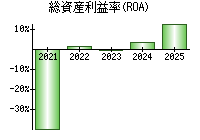
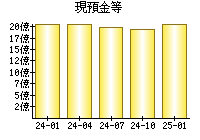
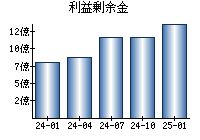
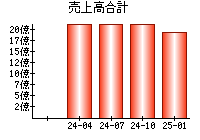
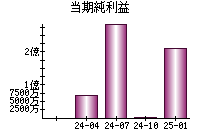
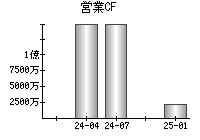
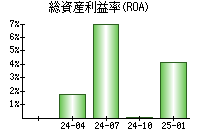
主な指標
【見方】一般に、経営状態が良い会社はグラフが右肩上がりになります。
決算書
貸借対照表(B/S)
【見方】一般に、経営が安定している会社は、黄色の部分の割合が大きく、色のバランスが毎年ほぼ同じになります。
円グラフにマウスをのせると項目を表示


損益計算書(P/L)
【見方】紫色の部分が円の左側にあるとき、会社の純利益がプラスです。一般に、純利益がプラスであり、紫色の割合は大きいほうが望ましいと言えます。
円グラフにマウスをのせると項目を表示


キャッシュフロー計算書(C/F)
【見方】赤色の部分が円の右側にあるとき、会社は本業が順調であると言えます。一般に、赤色の部分が右側にあり、その割合は大きいほうが望ましいです。
円グラフにマウスをのせると項目を表示


企業概要
| ホームページ | http://www.asakuma.co.jp/ |
|---|---|
| 住所(Googleストリートビュー) | 名古屋市天白区植田西2-1410 |
| 従業員数(単独) | 95 |
| 従業員数(連結) | 107 |
| 平均年齢(単独) | 43 |
| 平均勤続年数(単独) | 6.3年 |
| 平均年収(単独) | 415万円(第3,631位)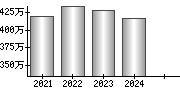
|
| 業種 | 小売業 |
| 決算月 | 1月 |
| 一株当たりの配当金 | - |
| 株主優待 |
(Yahoo!ファイナンス) |
| 経営課題・リスク等 |
サステナビリティ 対処すべき課題 事業等のリスク 経営上の重要な契約等 研究開発活動 設備投資等の概要 |
配信情報
- 情報が見つかりませんでした。
ニュース
 最新の情報を確認しています...
- (株)あさくま【7678】:株価・株式情報 - Yahoo!ファイナンス

- あさくま、株主優待を拡充! 7月に権利確定する抽選式優待で新たに5万円の食事券が100名に当たるほか、従来の「おせち」「1ポンドステーキ食事券」ももらえる! - ダイヤモンド・オンライン
- 外国人社員に「里帰り支援」 ステーキのあさくま、店長での活躍期待 - 朝日新聞
ブログ
- 最新の情報を確認しています...
大株主 (2024)
| 62.16% | |
| 6.46% | |
| 2.89% | |
| 2.75% | |
| 2.66% |
役員
| 代表取締役社長 | |
|---|---|
| 取締役管理部長 | |
| 取締役 | |
| 取締役 | |
| 取締役 |
EDINET提出書類
- 25.04.01
-
臨時報告書

- 25.03.14
-
臨時報告書
- 25.02.05
-
変更報告書
- 25.02.04
-
訂正報告書(大量保有報告書・変更報告書)
- 24.11.13
-
臨時報告書
就職・転職
- 情報が見つかりませんでした。