 pluszero
【東証グロース:5132】「情報・通信業」
pluszero
【東証グロース:5132】「情報・通信業」
 へ投稿
へ投稿
主な指標
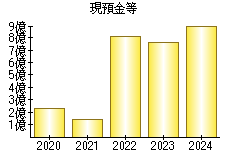
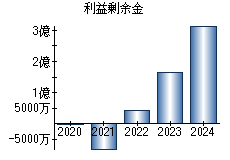
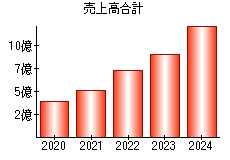
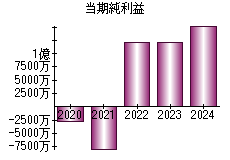
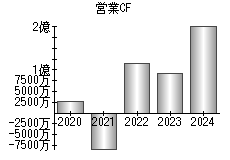
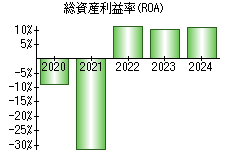
【見方】一般に、経営状態が良い会社はグラフが右肩上がりになります。
| 決算年月日 | 2020年10月31日 | 2021年10月31日 | 2022年10月31日 | 2023年10月31日 | 2024年10月31日 |
|---|---|---|---|---|---|
| 現預金等 | 226 | 139 | 806 | 762 | 901 |
| 利益剰余金 | -2 | -81 | 42 | 163 | 317 |
| 売上高 | 382 | 508 | 726 | 894 | 1,219 |
| 当期純利益 | -27 | -79 | 121 | 121 | 154 |
| 営業活動によるキャッシュフロー | 26 | -83 | 115 | 91 | 204 |
| 総資産利益率(ROA) | -8.89% | -31.38% | 11.83% | 10.36% | 10.89% |
※単位:百万円


PR
- 検索
- 業種別業績ランキング