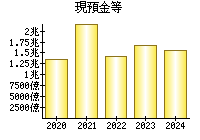
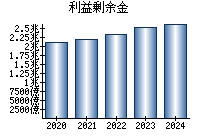
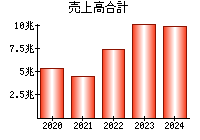
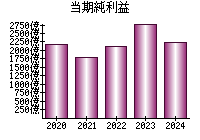
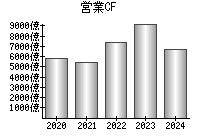
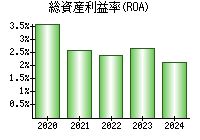
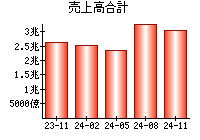
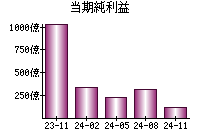
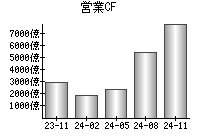
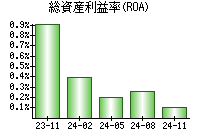
主な指標
【見方】一般に、経営状態が良い会社はグラフが右肩上がりになります。
決算書
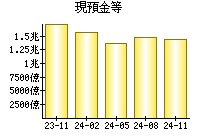
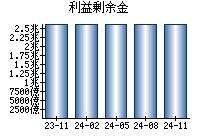
貸借対照表(B/S)
【見方】一般に、経営が安定している会社は、黄色の部分の割合が大きく、色のバランスが毎年ほぼ同じになります。
円グラフにマウスをのせると項目を表示


損益計算書(P/L)
【見方】紫色の部分が円の左側にあるとき、会社の純利益がプラスです。一般に、純利益がプラスであり、紫色の割合は大きいほうが望ましいと言えます。
円グラフにマウスをのせると項目を表示


キャッシュフロー計算書(C/F)
【見方】赤色の部分が円の右側にあるとき、会社は本業が順調であると言えます。一般に、赤色の部分が右側にあり、その割合は大きいほうが望ましいです。
円グラフにマウスをのせると項目を表示


企業概要
| ホームページ | https://www.7andi.com/ |
|---|---|
| 住所(Googleストリートビュー) | 東京都千代田区二番町8-8 |
| 従業員数(単独) | 1074 |
| 従業員数(連結) | 77902 |
| 平均年齢(単独) | 43.9 |
| 平均勤続年数(単独) | 15.8年 |
| 平均年収(単独) | 817万円(第517位)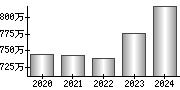
|
| 業種 | 小売業 |
| 決算月 | 2月 |
| 一株当たりの配当金 | 98.50 |
| 株主優待 |
(Yahoo!ファイナンス) |
| 経営課題・リスク等 |
対処すべき課題 事業等のリスク 経営上の重要な契約等 研究開発活動 設備投資等の概要 |
配信情報
 最新の情報を確認しています...
ニュース
- 最新の情報を確認しています...
- セブン&アイ、総会議案から消えた社名変更 「i」巡りすれ違い - 日本経済新聞

- ついに終焉の「井阪セブン」、大迷走の買収劇は「あのお家騒動」が元凶と言えるワケ(ビジネス+IT) - Yahoo!ニュース
- セブン&アイから「アイ」外す社名変更延期 買収対応に追われ総会に提案できず - 産経ニュース
ブログ
- 最新の情報を確認しています...
大株主 (2024)
| 14.83% | |
| 8.07% | |
| 5.09% | |
| 3.77% | |
| 2.5% |
役員
| 代表取締役社長執行役員社長最高経営責任者(CEO) | |
|---|---|
| 代表取締役副社長執行役員副社長スーパーストア事業管掌最高サステナビリティ責任者(CSuO)最高管理責任者(CAO)情報管理統括責任者 | |
| 取締役専務執行役員国内CVS事業統括 | |
| 取締役専務執行役員海外CVS事業(北米)統括 | |
| 取締役常務執行役員最高財務責任者(CFO)財務経理本部長 |
EDINET提出書類
- 25.05.09
-
自己株券買付状況報告書(法24条の6第1項に基づくもの)

- 25.04.17
-
臨時報告書
- 25.04.17
-
訂正発行登録書
- 25.04.04
-
大量保有報告書(特例対象株券等)
- 25.03.06
-
臨時報告書
就職・転職
採用情報URL