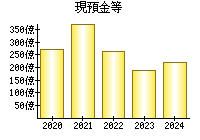
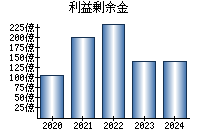
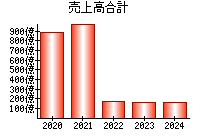
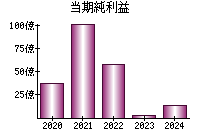
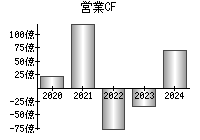
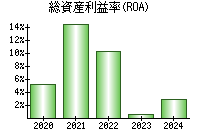
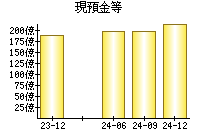
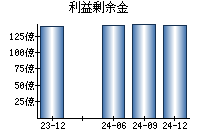
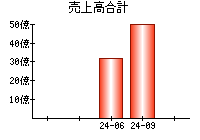
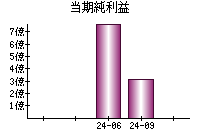
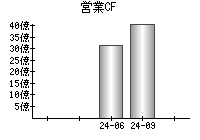
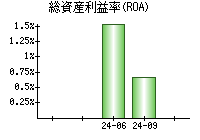
主な指標
【見方】一般に、経営状態が良い会社はグラフが右肩上がりになります。
決算書
貸借対照表(B/S)
【見方】一般に、経営が安定している会社は、黄色の部分の割合が大きく、色のバランスが毎年ほぼ同じになります。
円グラフにマウスをのせると項目を表示


損益計算書(P/L)
【見方】紫色の部分が円の左側にあるとき、会社の純利益がプラスです。一般に、純利益がプラスであり、紫色の割合は大きいほうが望ましいと言えます。
円グラフにマウスをのせると項目を表示


キャッシュフロー計算書(C/F)
【見方】赤色の部分が円の右側にあるとき、会社は本業が順調であると言えます。一般に、赤色の部分が右側にあり、その割合は大きいほうが望ましいです。
円グラフにマウスをのせると項目を表示


企業概要
| ホームページ | https://digital-holdings.co.jp/ |
|---|---|
| 住所(Googleストリートビュー) | 東京都千代田区四番町6 東急番町ビル |
| 従業員数(単独) | 100 |
| 従業員数(連結) | 1031 |
| 平均年齢(単独) | 39.6 |
| 平均勤続年数(単独) | 8.5年 |
| 平均年収(単独) | 791万円(第612位)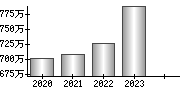
|
| 業種 | サービス業 |
| 決算月 | 12月 |
| 一株当たりの配当金 | 29.00 |
| 株主優待 |
(Yahoo!ファイナンス) |
| 経営課題・リスク等 |
対処すべき課題 事業等のリスク 経営上の重要な契約等 研究開発活動 設備投資等の概要 |
配信情報
- 情報が見つかりませんでした。
ニュース
 読み込み中です...
ブログ
- 読み込み中です...
大株主 (2023)
| 25.92% | |
| 7.36% | |
| 7.12% | |
| 5.22% | |
| 4.33% |
役員
| 代表取締役会長 | |
|---|---|
| 代表取締役社長グループCEO | |
| 取締役 | |
| 取締役(注)1 | |
| 取締役(注)1 |
EDINET提出書類
- 25.03.03
-
訂正報告書(大量保有報告書・変更報告書)

- 25.03.03
-
訂正報告書(大量保有報告書・変更報告書)
- 25.02.21
-
変更報告書
- 25.02.19
-
大量保有報告書
- 24.11.06
-
訂正臨時報告書
就職・転職
採用情報URL