 fonfun
【東証スタンダード:2323】「情報・通信業」
fonfun
【東証スタンダード:2323】「情報・通信業」
 へ投稿
へ投稿
主な指標
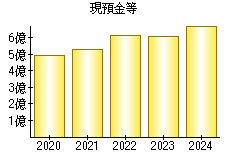
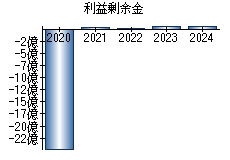
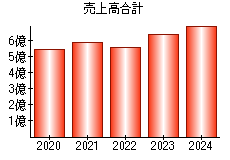
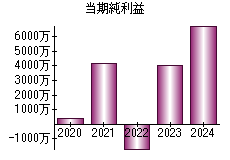
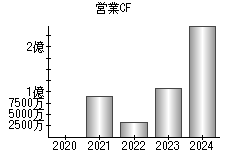
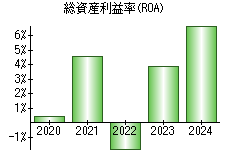
【見方】一般に、経営状態が良い会社はグラフが右肩上がりになります。
| 決算年月日 | 2020年3月31日 | 2021年3月31日 | 2022年3月31日 | 2023年3月31日 | 2024年3月31日 |
|---|---|---|---|---|---|
| 現預金等 | 494 | 531 | 614 | 606 | 678 |
| 利益剰余金 | -2,474 | 38 | 21 | 61 | 90 |
| 売上高 | 545 | 592 | 556 | 639 | 700 |
| 当期純利益 | 4 | 41 | -17 | 40 | 68 |
| 営業活動によるキャッシュフロー | 0 | 90 | 32 | 108 | 248 |
| 総資産利益率(ROA) | 0.45% | 4.58% | -1.80% | 3.88% | 6.76% |
※単位:百万円


PR

- 検索
- 業種別業績ランキング