 RISE
【東証スタンダード:8836】「不動産業」
RISE
【東証スタンダード:8836】「不動産業」
 へ投稿
へ投稿
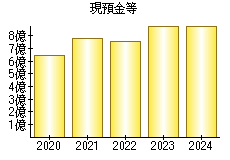
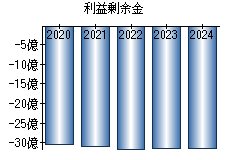
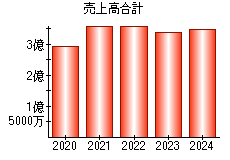
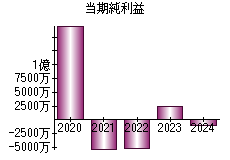
主な指標
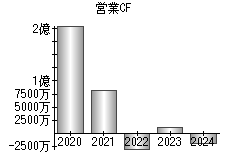
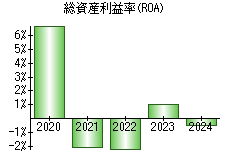
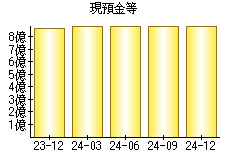
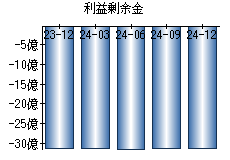
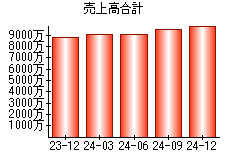
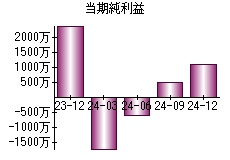
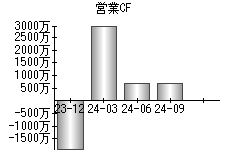
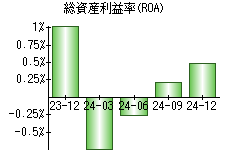
【見方】一般に、経営状態が良い会社はグラフが右肩上がりになります。
| 決算年月日 | 2020年3月31日 | 2021年3月31日 | 2022年3月31日 | 2023年3月31日 | 2024年3月31日 |
|---|---|---|---|---|---|
| 現預金等 | 644 | 780 | 752 | 879 | 886 |
| 利益剰余金 | -3,052 | -3,105 | -3,158 | -3,133 | -3,145 |
| 売上高 | 294 | 360 | 362 | 339 | 349 |
| 当期純利益 | 172 | -53 | -52 | 25 | -11 |
| 営業活動によるキャッシュフロー | 207 | 81 | -30 | 12 | -19 |
| 総資産利益率(ROA) | 6.73% | -2.08% | -2.17% | 1.05% | -0.48% |
※単位:百万円
PR
- 検索
- 業種別業績ランキング