 MIEコーポレーション
【名証メイン:3442】「金属製品」
MIEコーポレーション
【名証メイン:3442】「金属製品」
 へ投稿
へ投稿
主な指標
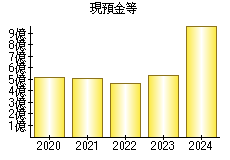
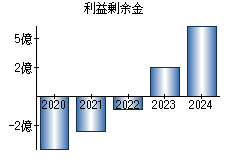
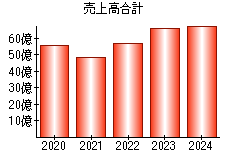
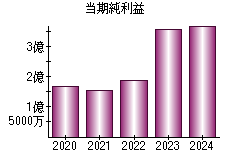
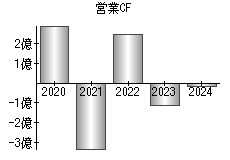
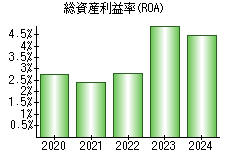
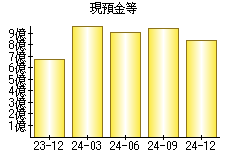
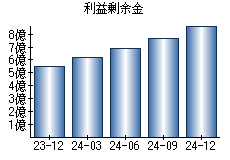
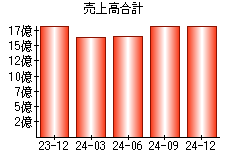
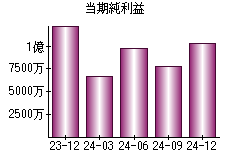
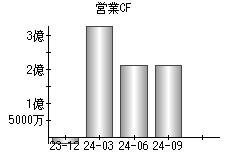
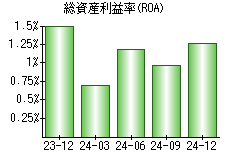
【見方】一般に、経営状態が良い会社はグラフが右肩上がりになります。
| 決算年月日 | 2020年3月31日 | 2021年3月31日 | 2022年3月31日 | 2023年3月31日 | 2024年3月31日 |
|---|---|---|---|---|---|
| 現預金等 | 516 | 503 | 464 | 533 | 972 |
| 利益剰余金 | -458 | -304 | -114 | 245 | 617 |
| 売上高 | 5,576 | 4,838 | 5,697 | 6,579 | 6,812 |
| 当期純利益 | 167 | 154 | 190 | 359 | 373 |
| 営業活動によるキャッシュフロー | 292 | -332 | 245 | -115 | -18 |
| 総資産利益率(ROA) | 2.77% | 2.38% | 2.79% | 4.93% | 4.45% |
※単位:百万円
PR
- 検索
- 業種別業績ランキング


