 FIXER
【東証グロース:5129】「情報・通信業」
FIXER
【東証グロース:5129】「情報・通信業」
 へ投稿
へ投稿
主な指標
【見方】一般に、経営状態が良い会社はグラフが右肩上がりになります。
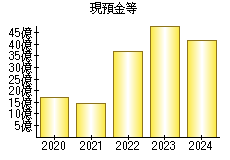
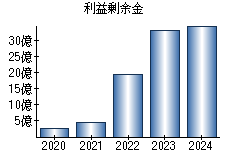
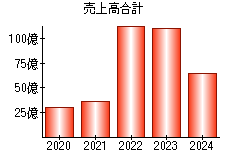
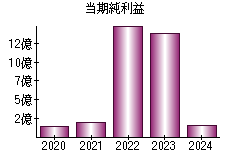
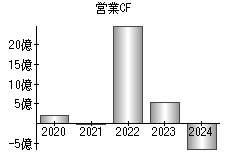
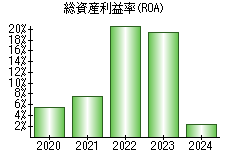
| 決算年月日 | 2020年8月31日 | 2021年8月31日 | 2022年8月31日 | 2023年8月31日 | 2024年8月31日 |
|---|---|---|---|---|---|
| 現預金等 | 1,710 | 1,467 | 3,688 | 4,837 | 4,157 |
| 利益剰余金 | 254 | 451 | 1,946 | 3,328 | 3,484 |
| 売上高 | 2,961 | 3,606 | 11,361 | 11,050 | 6,468 |
| 当期純利益 | 143 | 196 | 1,495 | 1,382 | 156 |
| 営業活動によるキャッシュフロー | 211 | -3 | 2,478 | 540 | -627 |
| 総資産利益率(ROA) | 5.55% | 7.46% | 20.80% | 19.36% | 2.37% |
※単位:百万円
PR
- 検索
- 業種別業績ランキング