 CAPITA
【東証スタンダード:7462】「小売業」
CAPITA
【東証スタンダード:7462】「小売業」
 へ投稿
へ投稿
主な指標
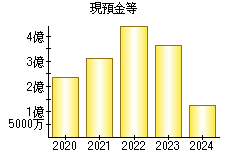
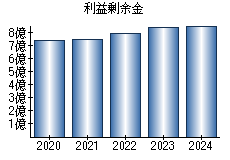
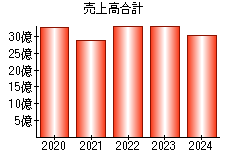
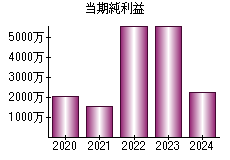
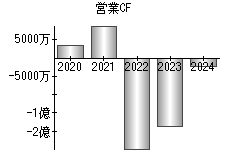
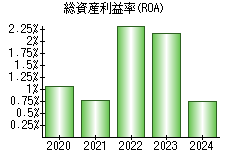
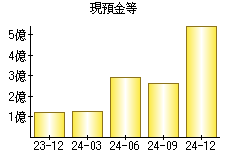
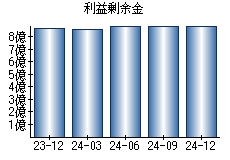
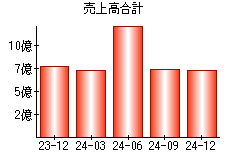
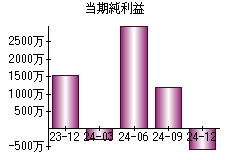
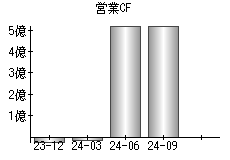
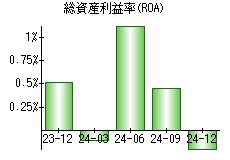
【見方】一般に、経営状態が良い会社はグラフが右肩上がりになります。
| 決算年月日 | 2020年3月31日 | 2021年3月31日 | 2022年3月31日 | 2023年3月31日 | 2024年3月31日 |
|---|---|---|---|---|---|
| 現預金等 | 236 | 309 | 444 | 364 | 126 |
| 利益剰余金 | 738 | 746 | 795 | 843 | 859 |
| 売上高 | 3,279 | 2,879 | 3,344 | 3,345 | 3,044 |
| 当期純利益 | 20 | 15 | 56 | 56 | 23 |
| 営業活動によるキャッシュフロー | 34 | 91 | -249 | -187 | -22 |
| 総資産利益率(ROA) | 1.06% | 0.77% | 2.35% | 2.17% | 0.76% |
※単位:百万円
PR
- 検索
- 業種別業績ランキング