 BlueMeme
【東証グロース:4069】「情報・通信業」
BlueMeme
【東証グロース:4069】「情報・通信業」
 へ投稿
へ投稿
主な指標
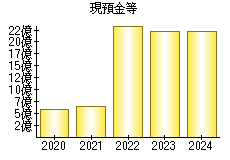
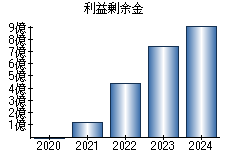
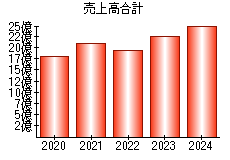
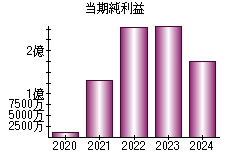
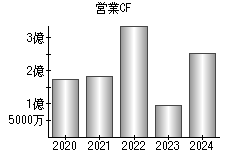
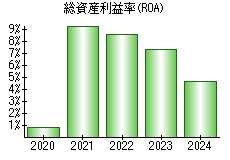
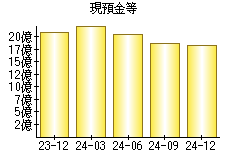
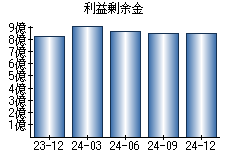
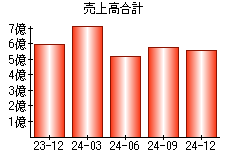
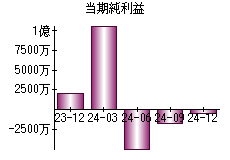
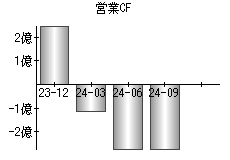
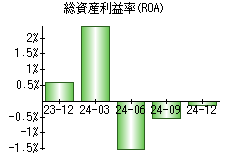
【見方】一般に、経営状態が良い会社はグラフが右肩上がりになります。
| 決算年月日 | 2020年3月31日 | 2021年3月31日 | 2022年3月31日 | 2023年3月31日 | 2024年3月31日 |
|---|---|---|---|---|---|
| 現預金等 | 584 | 645 | 2,356 | 2,225 | 2,229 |
| 利益剰余金 | -10 | 120 | 440 | 742 | 917 |
| 売上高 | 1,800 | 2,102 | 1,930 | 2,244 | 2,507 |
| 当期純利益 | 11 | 130 | 253 | 260 | 175 |
| 営業活動によるキャッシュフロー | 175 | 183 | 338 | 95 | 252 |
| 総資産利益率(ROA) | 0.83% | 9.40% | 8.56% | 7.35% | 4.68% |
※単位:百万円
PR
- 検索
- 業種別業績ランキング