 AViC
【東証グロース:9554】「サービス業」
AViC
【東証グロース:9554】「サービス業」
 へ投稿
へ投稿
主な指標
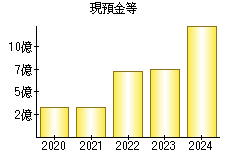
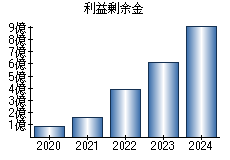
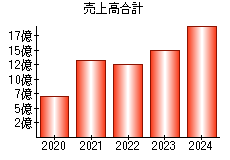
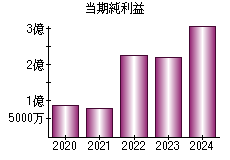
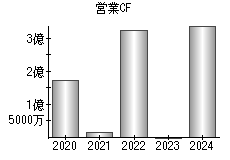
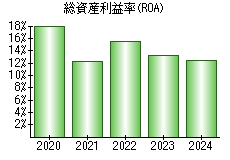
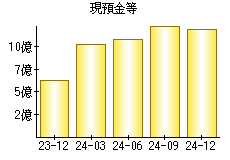
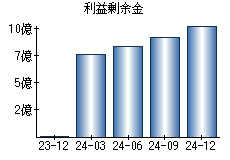
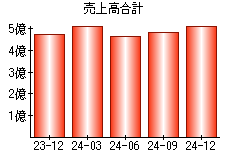
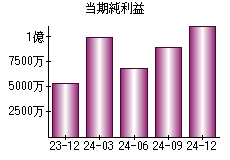
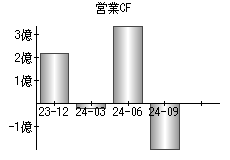
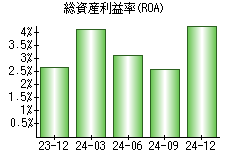
【見方】一般に、経営状態が良い会社はグラフが右肩上がりになります。
| 決算年月日 | 2023年12月31日 | 2024年3月31日 | 2024年6月30日 | 2024年9月30日 | 2024年12月31日 |
|---|---|---|---|---|---|
| 現預金等 | 630 | 1,020 | 1,082 | 1,241 | 1,190 |
| 利益剰余金 | 3 | 758 | 829 | 918 | 1,030 |
| 売上高 | 475 | 511 | 465 | 484 | 518 |
| 当期純利益 | 53 | 100 | 68 | 89 | 112 |
| 営業活動によるキャッシュフロー | 218 | -20 | 340 | -198 | - |
| 総資産利益率(ROA) | 2.64% | 4.10% | 3.10% | 2.60% | 4.28% |
※単位:百万円
PR
- 検索
- 業種別業績ランキング