主な指標
【見方】一般に、経営状態が良い会社はグラフが右肩上がりになります。
| 決算年月日 |
2020年3月31日 |
2021年3月31日 |
2022年3月31日 |
2023年3月31日 |
2024年3月31日 |
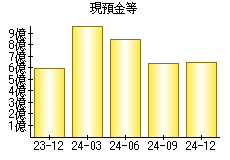
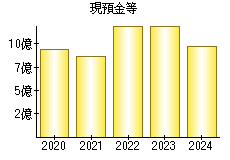
| 現預金等 |
934 |
868 |
1,191 |
1,202 |
970 |
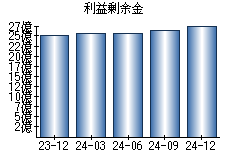
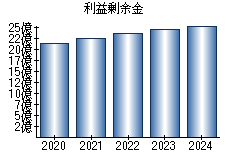
| 利益剰余金
損益取引により発生した剰余金。利益を源泉とした剰余金を示す。
|
2,137 |
2,257 |
2,355 |
2,455 |
2,554 |
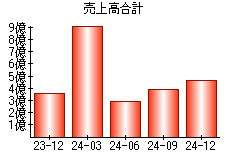
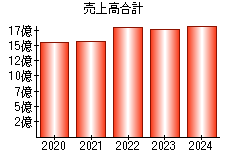
| 売上高 |
1,550 |
1,558 |
1,794 |
1,761 |
1,833 |
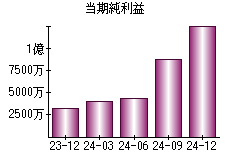
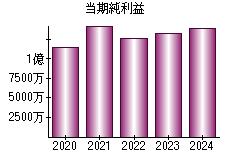
| 当期純利益
(税引前当期純利益)−(法人税等)
|
114 |
143 |
127 |
132 |
139 |
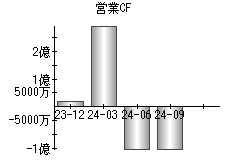
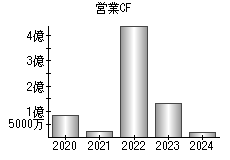
営業活動によるキャッシュフロー
営業活動に関する現金の流れを表す。
会社の本業によって稼ぎ出した現金であり、プラスである方が好ましい。
|
85 |
23 |
441 |
133 |
19 |
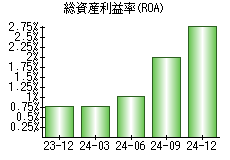
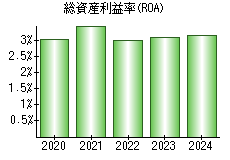
総資産利益率(ROA)
(利益)÷(総資産)
企業が持っている総資産が、利益を獲得するためにどのくらい有効活用されているかを示す指標。
|
3.03% |
3.49% |
3.00% |
3.09% |
3.16% |
※単位:百万円
| 決算年 |
2020 |
2021 |
2022 |
2023 |
2024 |
現在 |
| 売上高 |
3,497位 |
3,561位 |
3,573位 |
3,622位 |
3,623位 |
3,620位 |
| 当期純利益
(税引前当期純利益)−(法人税等)
|
2,682位 |
2,708位 |
2,989位 |
2,945位 |
2,994位 |
3,050位 |
営業活動によるキャッシュフロー
営業活動に関する現金の流れを表す。
会社の本業によって稼ぎ出した現金であり、プラスである方が好ましい。
|
2,945位 |
3,127位 |
2,464位 |
2,764位 |
3,173位 |
3,194位 |
| 総資産
資産合計。
|
3,199位 |
3,243位 |
3,274位 |
3,304位 |
3,323位 |
3,319位 |
| 現預金等 |
3,256位 |
3,440位 |
3,303位 |
3,316位 |
3,444位 |
3,463位 |
| 資本(純資産)合計
資本金・資本準備金・利益剰余金など。
|
3,007位 |
3,048位 |
3,078位 |
3,106位 |
3,116位 |
3,121位 |
| 現預金等増減 |
2,380位 |
2,818位 |
1,609位 |
2,007位 |
2,703位 |
2,733位 |
 細谷火工
【東証スタンダード:4274】「化学」
細谷火工
【東証スタンダード:4274】「化学」
 へ投稿
へ投稿