 日本PCサービス
【名証ネクスト:6025】「サービス業」
日本PCサービス
【名証ネクスト:6025】「サービス業」
 へ投稿
へ投稿
主な指標
【見方】一般に、経営状態が良い会社はグラフが右肩上がりになります。
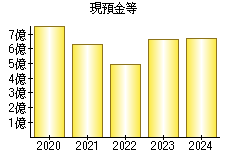
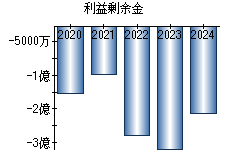
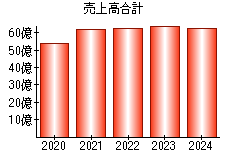
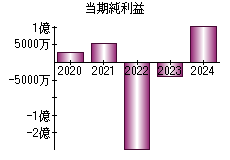
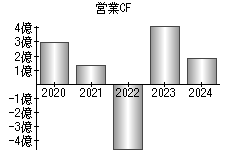
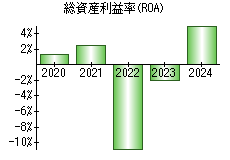
| 決算年月日 | 2020年8月31日 | 2021年8月31日 | 2022年8月31日 | 2023年8月31日 | 2024年8月31日 |
|---|---|---|---|---|---|
| 現預金等 | 762 | 628 | 496 | 665 | 667 |
| 利益剰余金 | -203 | -149 | -329 | -370 | -263 |
| 売上高 | 5,406 | 6,215 | 6,255 | 6,449 | 6,265 |
| 当期純利益 | 29 | 54 | -246 | -40 | 107 |
| 営業活動によるキャッシュフロー | 295 | 133 | -461 | 420 | 179 |
| 総資産利益率(ROA) | 1.32% | 2.45% | -10.79% | -2.02% | 5.07% |
※単位:百万円
PR
- 検索
- 業種別業績ランキング