 日本カーボン
【東証プライム:5302】「ガラス・土石製品」
日本カーボン
【東証プライム:5302】「ガラス・土石製品」
 へ投稿
へ投稿
主な指標
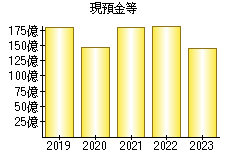
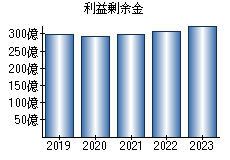
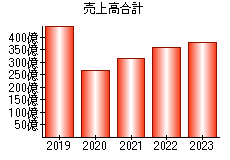
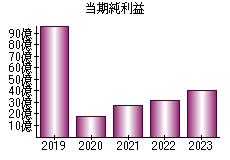
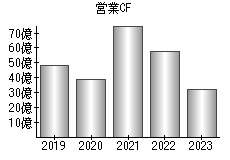
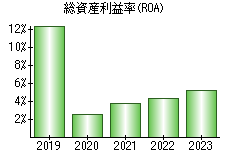
【見方】一般に、経営状態が良い会社はグラフが右肩上がりになります。
| 決算年月日 | 2019年12月31日 | 2020年12月31日 | 2021年12月31日 | 2022年12月31日 | 2023年12月31日 |
|---|---|---|---|---|---|
| 現預金等 | 17,852 | 14,600 | 17,865 | 18,322 | 14,527 |
| 利益剰余金 | 29,689 | 29,287 | 29,805 | 30,744 | 32,586 |
| 売上高 | 44,931 | 26,802 | 31,578 | 35,799 | 37,867 |
| 当期純利益 | 9,701 | 1,811 | 2,730 | 3,195 | 4,051 |
| 営業活動によるキャッシュフロー | 4,793 | 3,853 | 7,550 | 5,797 | 3,189 |
| 総資産利益率(ROA) | 12.45% | 2.55% | 3.76% | 4.31% | 5.16% |
※単位:百万円
PR

- 検索
- 業種別業績ランキング