 日本アジア投資
【東証スタンダード:8518】「証券業」
日本アジア投資
【東証スタンダード:8518】「証券業」
 へ投稿
へ投稿
主な指標
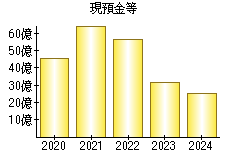
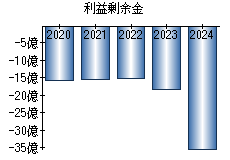
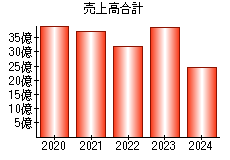
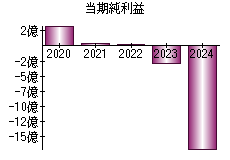
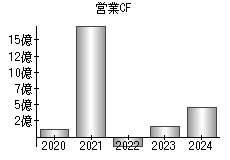
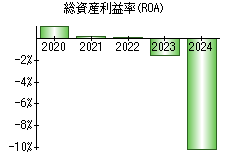
【見方】一般に、経営状態が良い会社はグラフが右肩上がりになります。
| 決算年月日 | 2020年3月31日 | 2021年3月31日 | 2022年3月31日 | 2023年3月31日 | 2024年3月31日 |
|---|---|---|---|---|---|
| 現預金等 | 4,520 | 6,486 | 5,666 | 3,130 | 2,544 |
| 利益剰余金 | -1,583 | -1,548 | -1,540 | -1,834 | -3,540 |
| 売上高 | 3,950 | 3,709 | 3,204 | 3,872 | 2,444 |
| 当期純利益 | 344 | 34 | 20 | -293 | -1,699 |
| 営業活動によるキャッシュフロー | 124 | 1,729 | -144 | 160 | 458 |
| 総資産利益率(ROA) | 1.20% | 0.14% | 0.10% | -1.56% | -10.12% |
※単位:百万円


PR

- 検索
- 業種別業績ランキング