 技研製作所
【東証プライム:6289】「機械」
技研製作所
【東証プライム:6289】「機械」
 へ投稿
へ投稿
主な指標
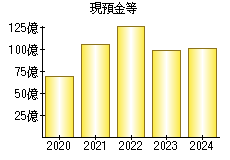
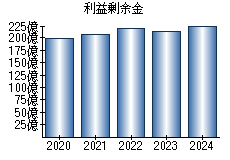
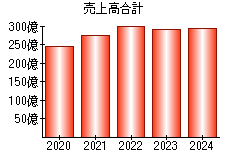
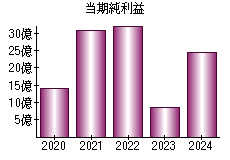
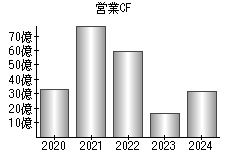
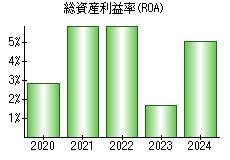
【見方】一般に、経営状態が良い会社はグラフが右肩上がりになります。
| 決算年月日 | 2020年8月31日 | 2021年8月31日 | 2022年8月31日 | 2023年8月31日 | 2024年8月31日 |
|---|---|---|---|---|---|
| 現預金等 | 6,882 | 10,589 | 12,818 | 9,917 | 10,180 |
| 利益剰余金 | 19,942 | 20,596 | 21,908 | 21,244 | 22,602 |
| 売上高 | 24,640 | 27,618 | 30,378 | 29,272 | 29,481 |
| 当期純利益 | 1,401 | 3,074 | 3,235 | 848 | 2,438 |
| 営業活動によるキャッシュフロー | 3,262 | 7,769 | 5,924 | 1,649 | 3,139 |
| 総資産利益率(ROA) | 2.82% | 5.95% | 5.91% | 1.65% | 5.07% |
※単位:百万円
PR
- 検索
- 業種別業績ランキング