 坪田ラボ
【東証グロース:4890】「医薬品」
坪田ラボ
【東証グロース:4890】「医薬品」
 へ投稿
へ投稿
主な指標
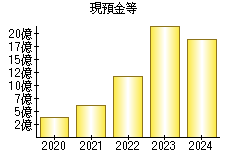
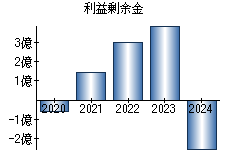
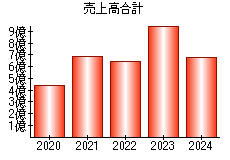
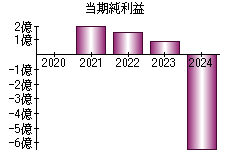
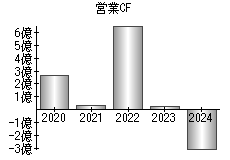
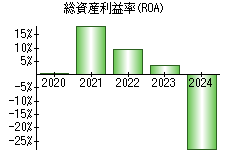
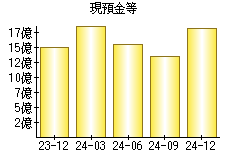
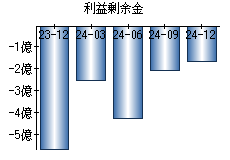
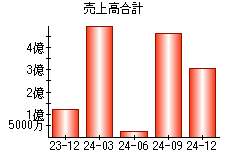
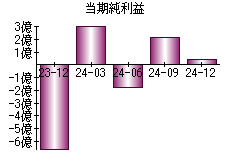
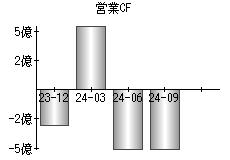
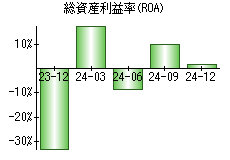
【見方】一般に、経営状態が良い会社はグラフが右肩上がりになります。
| 決算年月日 | 2020年3月31日 | 2021年3月31日 | 2022年3月31日 | 2023年3月31日 | 2024年3月31日 |
|---|---|---|---|---|---|
| 現預金等 | 381 | 611 | 1,175 | 2,161 | 1,883 |
| 利益剰余金 | -57 | 145 | 298 | 388 | -253 |
| 売上高 | 442 | 688 | 641 | 955 | 674 |
| 当期純利益 | 3 | 202 | 153 | 90 | -641 |
| 営業活動によるキャッシュフロー | 263 | 37 | 655 | 28 | -301 |
| 総資産利益率(ROA) | 0.57% | 18.69% | 9.48% | 3.37% | -27.94% |
※単位:百万円
PR
- 検索
- 業種別業績ランキング