 北浜キャピタルパートナーズ
【東証スタンダード:2134】「サービス業」
北浜キャピタルパートナーズ
【東証スタンダード:2134】「サービス業」
 へ投稿
へ投稿
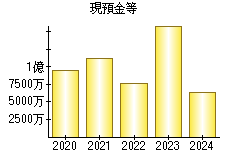
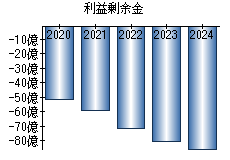
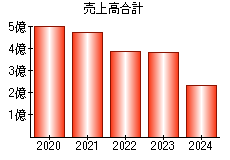
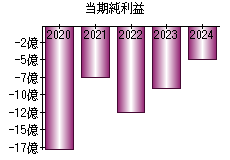
主な指標
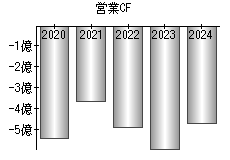
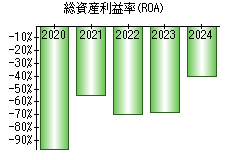
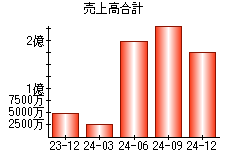
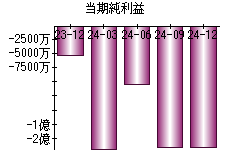
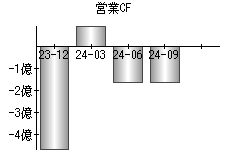
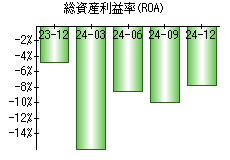
【見方】一般に、経営状態が良い会社はグラフが右肩上がりになります。
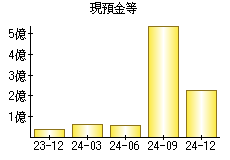
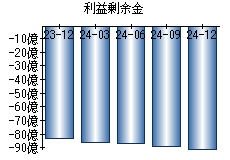
| 決算年月日 | 2023年12月31日 | 2024年3月31日 | 2024年6月30日 | 2024年9月30日 | 2024年12月31日 |
|---|---|---|---|---|---|
| 現預金等 | 39 | 63 | 54 | 543 | 225 |
| 利益剰余金 | -8,341 | -8,582 | -8,674 | -8,875 | -9,095 |
| 売上高 | 48 | 26 | 198 | 233 | 176 |
| 当期純利益 | -53 | -218 | -105 | -216 | -217 |
| 営業活動によるキャッシュフロー | -468 | 100 | -164 | -164 | - |
| 総資産利益率(ROA) | -4.78% | -15.96% | -8.56% | -9.99% | -7.84% |
※単位:百万円
PR
- 検索
- 業種別業績ランキング