 中外製薬
【東証プライム:4519】「医薬品」
中外製薬
【東証プライム:4519】「医薬品」
 へ投稿
へ投稿
主な指標
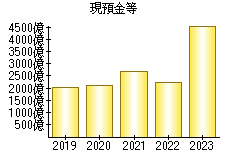
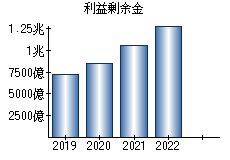
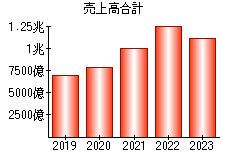
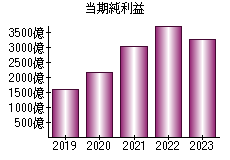
【見方】一般に、経営状態が良い会社はグラフが右肩上がりになります。
| 決算年月日 | 2019年12月31日 | 2020年12月31日 | 2021年12月31日 | 2022年12月31日 | 2023年12月31日 |
|---|---|---|---|---|---|
| 現預金等 | 203,941 | 212,333 | 267,753 | 222,169 | 458,674 |
| 利益剰余金 | 722,076 | 849,093 | 1,054,050 | 1,293,352 | 1,488,738 |
| 売上高 | 686,184 | 786,946 | 999,759 | 1,259,726 | 1,111,367 |
| 当期純利益 | 157,560 | 214,733 | 302,995 | 374,429 | 325,472 |
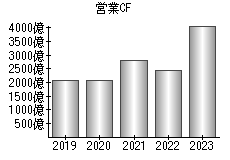
| 営業活動によるキャッシュフロー | 206,641 | 205,036 | 279,626 | 244,112 | 409,924 |
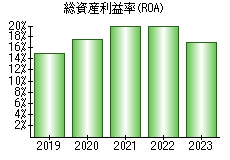
| 総資産利益率(ROA) | 14.88% | 17.38% | 19.69% | 20.03% | 16.84% |
※単位:百万円
PR

- 検索
- 業種別業績ランキング