 ワキタ
【東証プライム:8125】「卸売業」
ワキタ
【東証プライム:8125】「卸売業」
 へ投稿
へ投稿
主な指標
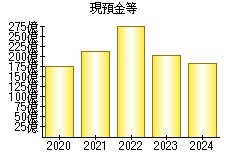
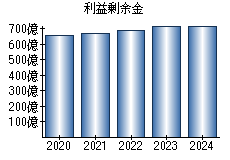
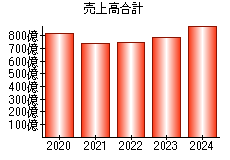
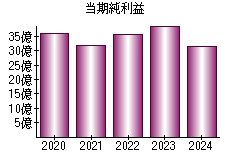
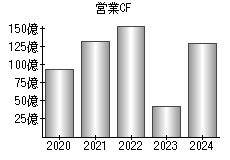
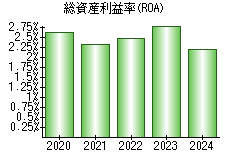
【見方】一般に、経営状態が良い会社はグラフが右肩上がりになります。
| 決算年月日 | 2020年2月29日 | 2021年2月28日 | 2022年2月28日 | 2023年2月28日 | 2024年2月29日 |
|---|---|---|---|---|---|
| 現預金等 | 17,498 | 21,124 | 27,774 | 20,210 | 18,338 |
| 利益剰余金 | 65,358 | 67,064 | 68,675 | 71,092 | 72,383 |
| 売上高 | 82,275 | 74,015 | 74,989 | 78,870 | 88,654 |
| 当期純利益 | 3,608 | 3,192 | 3,574 | 3,902 | 3,160 |
| 営業活動によるキャッシュフロー | 9,375 | 13,226 | 15,521 | 4,168 | 13,024 |
| 総資産利益率(ROA) | 2.62% | 2.32% | 2.48% | 2.81% | 2.20% |
※単位:百万円
PR
- 検索
- 業種別業績ランキング