 リファインバースグループ
【東証グロース:7375】「サービス業」
リファインバースグループ
【東証グロース:7375】「サービス業」
 へ投稿
へ投稿
主な指標
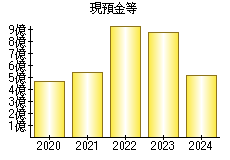
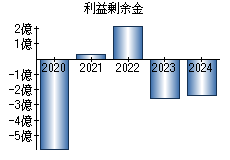
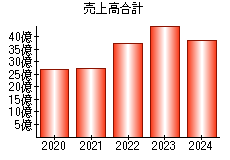
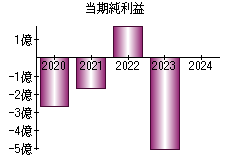
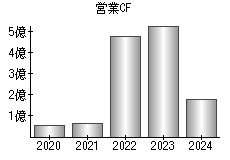
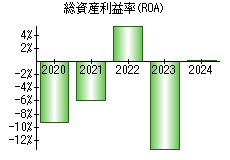
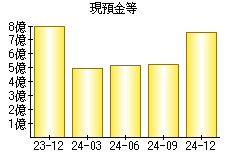
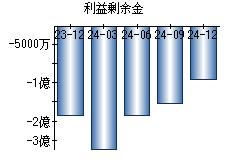
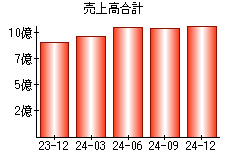
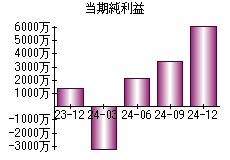
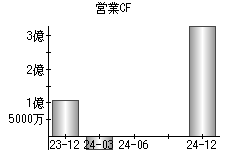
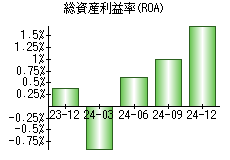
【見方】一般に、経営状態が良い会社はグラフが右肩上がりになります。
| 決算年月日 | 2020年6月30日 | 2021年6月30日 | 2022年6月30日 | 2023年6月30日 | 2024年6月30日 |
|---|---|---|---|---|---|
| 現預金等 | 461 | 535 | 935 | 873 | 512 |
| 利益剰余金 | -589 | 30 | 223 | -261 | -236 |
| 売上高 | 2,695 | 2,723 | 3,733 | 4,472 | 3,853 |
| 当期純利益 | -269 | -171 | 183 | -505 | 5 |
| 営業活動によるキャッシュフロー | 55 | 63 | 476 | 531 | 175 |
| 総資産利益率(ROA) | -9.36% | -5.85% | 5.62% | -13.34% | 0.15% |
※単位:百万円
PR
- 検索
- 業種別業績ランキング