 ラピーヌ
【東証スタンダード:8143】「繊維製品」
ラピーヌ
【東証スタンダード:8143】「繊維製品」
 へ投稿
へ投稿
主な指標
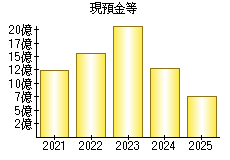
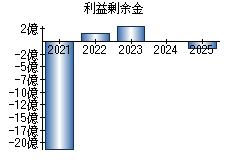
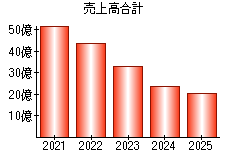
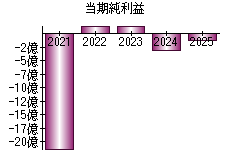
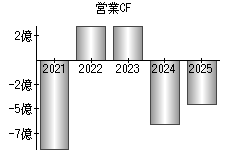
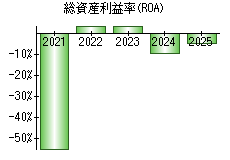
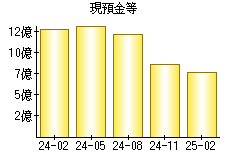
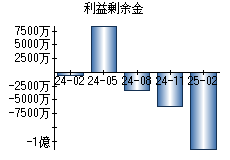
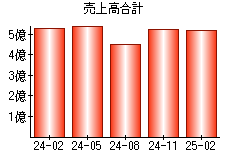
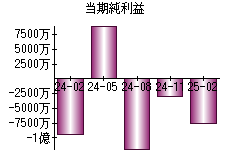
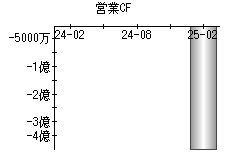
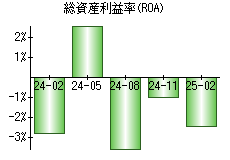
【見方】一般に、経営状態が良い会社はグラフが右肩上がりになります。
| 決算年月日 | 2021年2月28日 | 2022年2月28日 | 2023年2月28日 | 2024年2月29日 | 2025年2月28日 |
|---|---|---|---|---|---|
| 現預金等 | 1,232 | 1,560 | 2,088 | 1,279 | 761 |
| 利益剰余金 | -2,121 | 164 | 322 | -5 | -140 |
| 売上高 | 5,228 | 4,374 | 3,300 | 2,342 | 2,043 |
| 当期純利益 | -2,136 | 155 | 158 | -322 | -134 |
| 営業活動によるキャッシュフロー | -911 | 358 | 361 | -661 | -452 |
| 総資産利益率(ROA) | -55.05% | 4.22% | 3.93% | -9.36% | -4.42% |
※単位:百万円
PR
- 検索
- 業種別業績ランキング


