 メディシノバ・インク
【東証スタンダード:4875】「医薬品」
メディシノバ・インク
【東証スタンダード:4875】「医薬品」
 へ投稿
へ投稿
主な指標
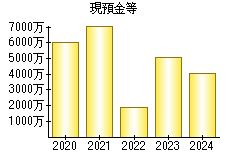
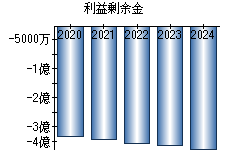
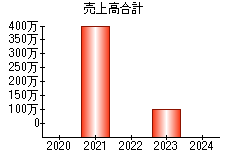
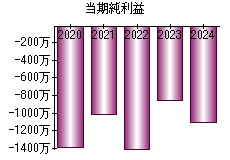
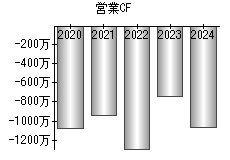
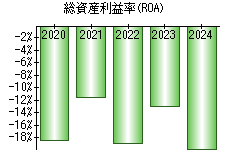
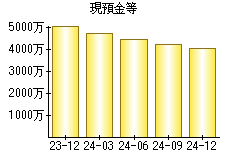
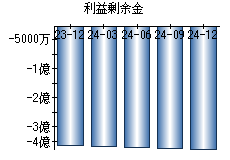
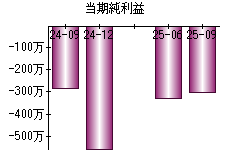
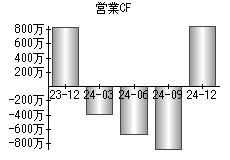
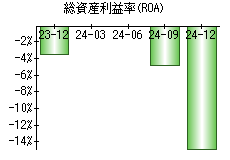
【見方】一般に、経営状態が良い会社はグラフが右肩上がりになります。
| 決算年月日 | 2020年12月31日 | 2021年12月31日 | 2022年12月31日 | 2023年12月31日 | 2024年12月31日 |
|---|---|---|---|---|---|
| 現預金等 | 60 | 71 | 19 | 51 | 40 |
| 利益剰余金 | -383 | -393 | -407 | -416 | -427 |
| 売上高 | 0 | 4 | 0 | 1 | 0 |
| 当期純利益 | -14 | -10 | -14 | -9 | -11 |
| 営業活動によるキャッシュフロー | -11 | -9 | -13 | -7 | -11 |
| 総資産利益率(ROA) | -18.37% | -11.59% | -18.97% | -12.93% | -19.78% |
※単位:百万円
PR
- 検索
- 業種別業績ランキング