 メディアファイブ
【福証Q-Board:3824】「情報・通信業」
メディアファイブ
【福証Q-Board:3824】「情報・通信業」
 へ投稿
へ投稿
主な指標
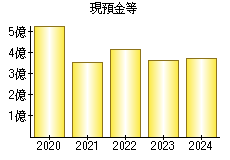
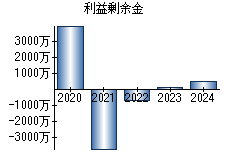
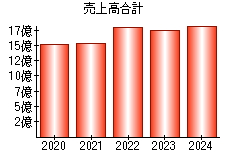
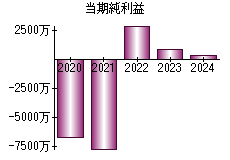
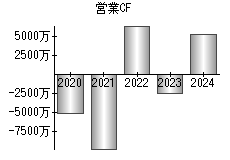
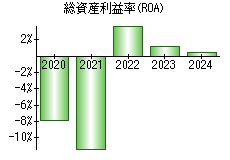
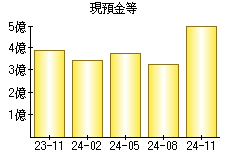
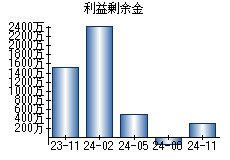
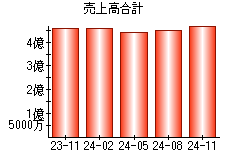
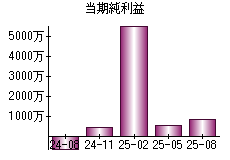
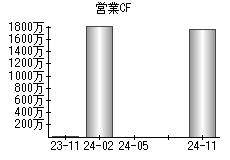
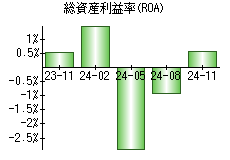
【見方】一般に、経営状態が良い会社はグラフが右肩上がりになります。
| 決算年月日 | 2020年5月31日 | 2021年5月31日 | 2022年5月31日 | 2023年5月31日 | 2024年5月31日 |
|---|---|---|---|---|---|
| 現預金等 | 530 | 354 | 414 | 364 | 373 |
| 利益剰余金 | 40 | -37 | -7 | 1 | 5 |
| 売上高 | 1,513 | 1,537 | 1,799 | 1,748 | 1,835 |
| 当期純利益 | -67 | -77 | 30 | 8 | 4 |
| 営業活動によるキャッシュフロー | -51 | -99 | 66 | -24 | 54 |
| 総資産利益率(ROA) | -7.92% | -11.38% | 3.83% | 1.19% | 0.50% |
※単位:百万円
PR
- 検索
- 業種別業績ランキング