 ペルセウスプロテオミクス
【東証グロース:4882】「医薬品」
ペルセウスプロテオミクス
【東証グロース:4882】「医薬品」
 へ投稿
へ投稿
主な指標
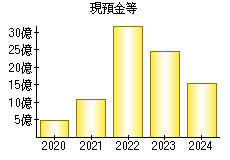
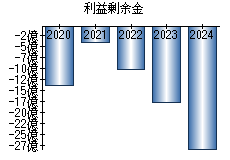
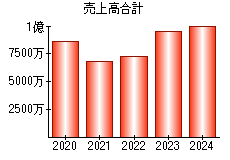
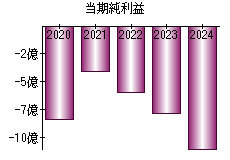
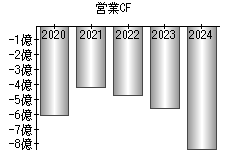
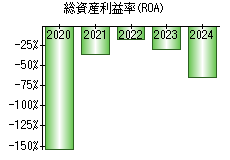
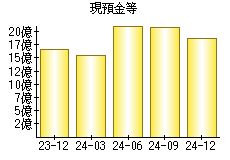
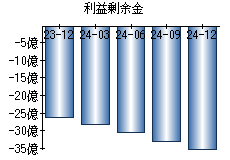
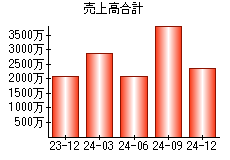
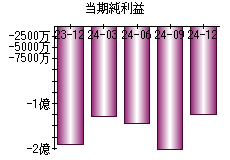
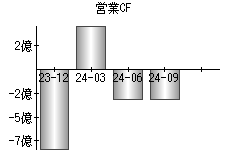
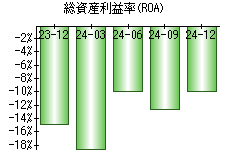
【見方】一般に、経営状態が良い会社はグラフが右肩上がりになります。
| 決算年月日 | 2023年12月31日 | 2024年3月31日 | 2024年6月30日 | 2024年9月30日 | 2024年12月31日 |
|---|---|---|---|---|---|
| 現預金等 | 1,664 | 1,541 | 2,126 | 2,086 | 1,879 |
| 利益剰余金 | -2,636 | -2,830 | -3,040 | -3,320 | -3,519 |
| 売上高 | 21 | 29 | 21 | 39 | 24 |
| 当期純利益 | -266 | -205 | -219 | -276 | -199 |
| 営業活動によるキャッシュフロー | -834 | 465 | -312 | -312 | - |
| 総資産利益率(ROA) | -14.82% | -18.55% | -9.93% | -12.61% | -9.97% |
※単位:百万円
PR
- 検索
- 業種別業績ランキング