 ベクトル
【東証プライム:6058】「サービス業」
ベクトル
【東証プライム:6058】「サービス業」
 へ投稿
へ投稿
主な指標
【見方】一般に、経営状態が良い会社はグラフが右肩上がりになります。
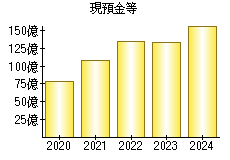
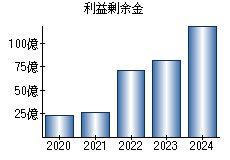
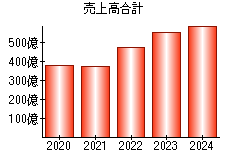
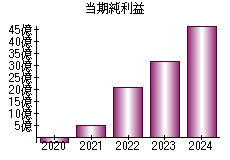
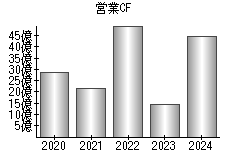
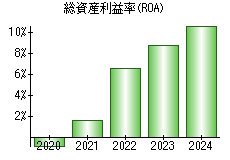
| 決算年月日 | 2020年2月29日 | 2021年2月28日 | 2022年2月28日 | 2023年2月28日 | 2024年2月29日 |
|---|---|---|---|---|---|
| 現預金等 | 7,890 | 10,860 | 13,522 | 13,372 | 15,820 |
| 利益剰余金 | 2,328 | 2,664 | 7,080 | 8,182 | 11,950 |
| 売上高 | 37,540 | 37,274 | 47,351 | 55,225 | 59,212 |
| 当期純利益 | -199 | 487 | 2,072 | 3,173 | 4,685 |
| 営業活動によるキャッシュフロー | 2,869 | 2,137 | 4,977 | 1,457 | 4,450 |
| 総資産利益率(ROA) | -0.84% | 1.62% | 6.56% | 8.73% | 10.74% |
※単位:百万円
PR
- 検索
- 業種別業績ランキング