 ブランディングテクノロジー
【東証グロース:7067】「サービス業」
ブランディングテクノロジー
【東証グロース:7067】「サービス業」
 へ投稿
へ投稿
主な指標
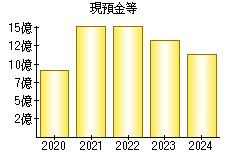
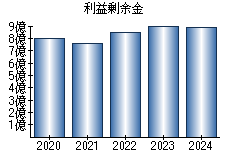
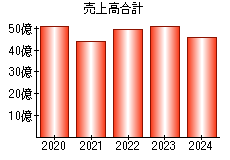
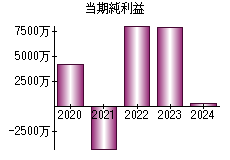
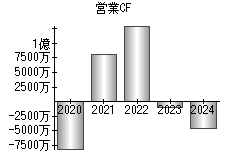
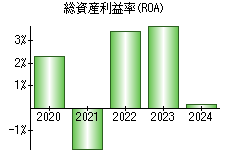
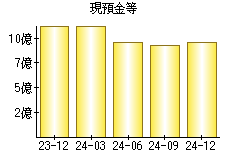
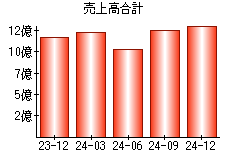
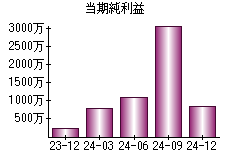
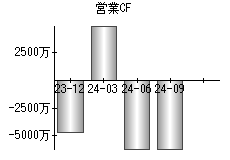
【見方】一般に、経営状態が良い会社はグラフが右肩上がりになります。


| 決算年月日 | 2023年12月31日 | 2024年3月31日 | 2024年6月30日 | 2024年9月30日 | 2024年12月31日 |
|---|---|---|---|---|---|
| 現預金等 | 1,122 | 1,131 | 955 | 929 | 952 |
| 利益剰余金 | 880 | 889 | 866 | 897 | 906 |
| 売上高 | 1,166 | 1,234 | 1,032 | 1,248 | 1,318 |
| 当期純利益 | 2 | 8 | 11 | 31 | 8 |
| 営業活動によるキャッシュフロー | -47 | 49 | -62 | -62 | - |
| 総資産利益率(ROA) | 0.13% | 0.41% | 0.59% | 1.68% | 0.45% |
※単位:百万円
PR
- 検索
- 業種別業績ランキング