 ビーマップ
【東証グロース:4316】「情報・通信業」
ビーマップ
【東証グロース:4316】「情報・通信業」
 へ投稿
へ投稿
主な指標
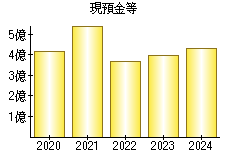
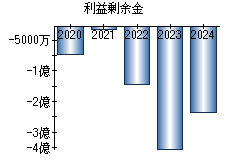
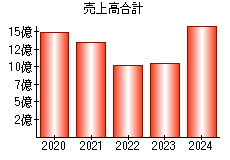
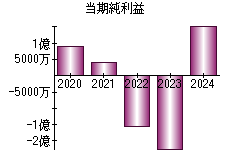
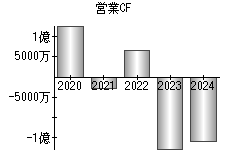
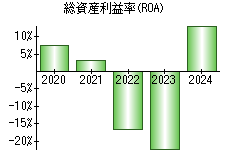
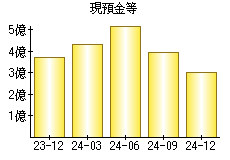
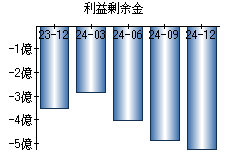
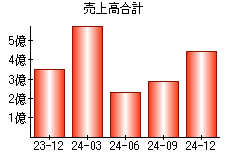
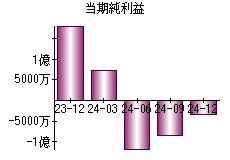
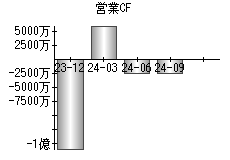
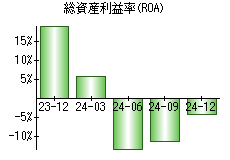
【見方】一般に、経営状態が良い会社はグラフが右肩上がりになります。
| 決算年月日 | 2023年12月31日 | 2024年3月31日 | 2024年6月30日 | 2024年9月30日 | 2024年12月31日 |
|---|---|---|---|---|---|
| 現預金等 | 371 | 433 | 523 | 393 | 300 |
| 利益剰余金 | -351 | -285 | -404 | -488 | -523 |
| 売上高 | 351 | 581 | 232 | 288 | 446 |
| 当期純利益 | 183 | 72 | -117 | -85 | -33 |
| 営業活動によるキャッシュフロー | -159 | 62 | -25 | -25 | - |
| 総資産利益率(ROA) | 19.38% | 5.92% | -13.16% | -11.08% | -4.21% |
※単位:百万円
PR
- 検索
- 業種別業績ランキング